Bluesky Analytics: How to Track Your Growth (2026)
Bluesky has no built-in analytics. We tested 5 free tools that track followers, engagement rate, and best times to post on Bluesky.
Quick answer
Track Bluesky growth using third-party analytics tools like Schedulala since Bluesky has no built-in analytics dashboard.
- •Bluesky does not offer native analytics for individual accounts
- •Third-party tools track followers, engagement rate, top posts, and posting patterns
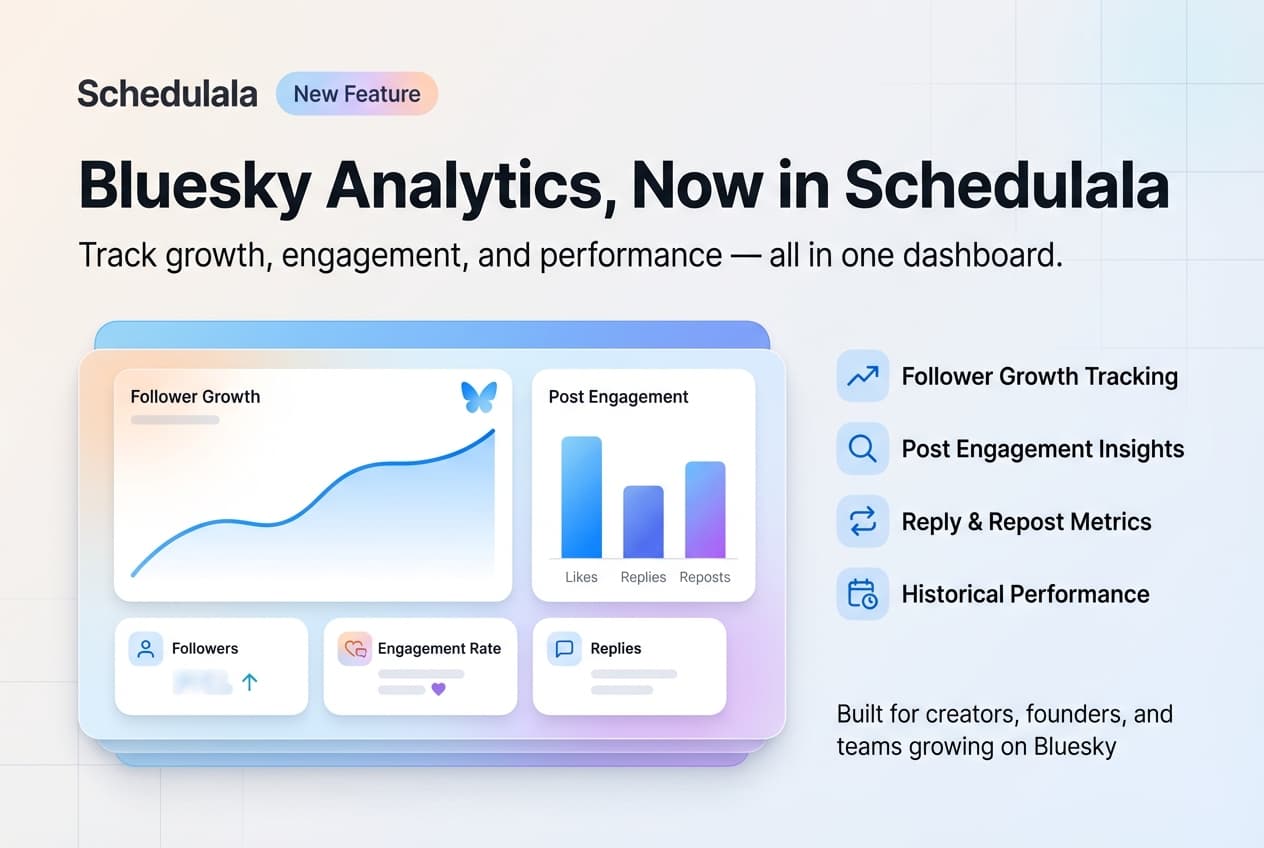
- •Schedulala's Team plan ($18/month) includes Bluesky analytics alongside 9 other platforms
- •Key metrics to track: follower growth, likes per post, reposts, and reply rate

You're posting on Bluesky. But is it working?
On Instagram and Twitter, you can dive into detailed analytics dashboards. On Bluesky... it's more complicated. The platform is still young, and robust analytics tools are limited.
But that doesn't mean you can't track your growth. You just need to know where to look and what to measure.
This guide covers everything available for Bluesky analytics in 2026.
Try Schedulala for free
Schedule posts to Bluesky, Twitter, and 8 other platforms from one dashboard.
Get started for free→The Current State of Bluesky Analytics
Let's be honest upfront: Bluesky analytics are limited compared to mature platforms.
What Bluesky Shows You Natively
- Follower count
- Like counts on individual posts
- Reply counts on individual posts
- Repost counts on individual posts
What Bluesky Doesn't Show You (Yet)
- Follower growth over time
- Impressions/reach per post
- Profile views
- Engagement rate calculations
- Audience demographics
- Best posting times based on your data
What Metrics Should You Track on Bluesky?
Before diving into how to track, let's clarify what's worth tracking.
Metrics That Matter
1. Follower Growth
What it tells you: Whether your audience is growing over time. How to track: Manual logging (screenshot or record your follower count weekly). What's good: Steady growth, even if slow. Sudden spikes are nice but consistent growth indicates sustainable content.
2. Engagement Per Post
What it tells you: How well individual posts resonate. How to track: Record likes + replies + reposts for each post. What's good: Higher engagement on educational content and questions typically indicates you're providing value.
3. Reply Rate
What it tells you: Whether you're sparking conversation. How to track: Count replies relative to likes. A post with 10 likes and 8 replies is outperforming one with 50 likes and 2 replies in terms of conversation. Why it matters: Bluesky's culture values conversation. High reply rates signal community building.
4. Repost Rate
What it tells you: Whether your content is shareable. How to track: Note which posts get reposted and look for patterns. Why it matters: Reposts extend your reach beyond your followers.
5. Follower Quality
What it tells you: Whether you're attracting the right audience. How to track: Periodically review who's following you. Are they your target audience? Why it matters: 500 relevant followers beat 5,000 random ones for business impact.
Metrics That Matter Less
Raw follower count: Vanity metric. Growth rate and follower quality matter more.
Likes alone: Likes are easy. Replies and reposts indicate deeper engagement.
Comparison to other platforms: Bluesky is smaller. Comparing raw numbers to Twitter is meaningless.
Native Bluesky Analytics
Here's what you can see directly in Bluesky:
Profile Stats
Your profile shows your current follower count and following count. That's it.
To track growth, you'll need to manually record this number over time.
Post-Level Stats
Each post shows:
- Number of likes
- Number of replies
- Number of reposts
- Number of quote posts
Tap on any post to see these metrics.
What's Missing
- Historical data
- Trends over time
- Impressions/views
- Demographic information
- Aggregate stats across posts
Bluesky may add more native analytics in the future, but for now, this is what's available.
Third-Party Bluesky Analytics Tools
A few third-party tools offer Bluesky analytics. Here's what's available:
Fedica (Formerly Tweepsmap)
What it offers: Follower analytics, engagement tracking, best time to post suggestions, audience insights.
Pricing: From $10/month
Pros: Most comprehensive Bluesky analytics currently available.
Cons: Expensive for basic analytics. Bluesky support is newer than their Twitter features.
Clearsky
What it offers: Block list transparency, who blocked you / who you blocked, basic account stats.
Pricing: Free
Pros: Free and useful for specific use cases.
Cons: Limited analytics focus — more about transparency than growth tracking.
Bluesky API + Custom Solutions
What it offers: Anything you want to build.
Pricing: Free (requires development)
Pros: Full control, exactly what you need.
Cons: Requires technical skills to build and maintain.
What's Coming
The analytics tool landscape for Bluesky is still developing. As the platform grows, more tools will emerge.
Note: We're building analytics features for Schedulala. If you're using Schedulala for scheduling, analytics integration is on our roadmap.
Manual Tracking: The DIY Approach
Until better tools exist, manual tracking works surprisingly well. Here's a simple system:
Weekly Tracking Spreadsheet
Create a spreadsheet with columns for: Date, Followers, Posts This Week, Total Likes, Total Replies, Total Reposts, and Notes.
Track weekly. It takes 5 minutes and gives you trend data over time.
Post Performance Log
For more detail, track individual posts with: Date, Post Type, Topic, Likes, Replies, Reposts, and Time Posted.
After 20-30 posts, patterns emerge: which topics resonate, which formats perform best, which times get engagement.
Monthly Review
Once a month, review your data:
- Follower growth: Up, down, or flat?
- Best-performing posts: What do they have in common?
- Worst-performing posts: What can you learn?
- Engagement trends: Improving or declining?
- Content mix: Right balance of types?
This takes 30 minutes monthly but provides actionable insights.
How to Calculate Key Metrics
Engagement Rate
(Likes + Replies + Reposts) ÷ Followers × 100 = Engagement Rate %
Example: Post gets 50 likes, 20 replies, 10 reposts. You have 1,000 followers.
(50 + 20 + 10) ÷ 1,000 × 100 = 8% engagement rate
Benchmarks: 1-3% is average, 3-6% is good, 6%+ is excellent.
Bluesky engagement rates tend to be higher than Twitter due to smaller, more engaged audiences.
Follower Growth Rate
(New Followers ÷ Starting Followers) × 100 = Growth Rate %
Example: Started the month with 500 followers, ended with 600.
(100 ÷ 500) × 100 = 20% monthly growth
Benchmarks: 5-10%/month is steady growth, 10-20%/month is strong growth, 20%+/month is exceptional.
Reply Ratio
Replies ÷ Likes = Reply Ratio
Example: Post has 30 likes and 15 replies. 15 ÷ 30 = 0.5 reply ratio
Interpretation: Below 0.1 is low conversation (broadcast content), 0.1-0.3 is normal, 0.3+ is high conversation (community building).
Using Analytics to Improve
Data is useless if you don't act on it. Here's how to use your insights:
Find Your Best Content Types
Look at your top 10 posts by engagement. What do they have in common? Format (question, tip, thread, opinion)? Topic? Length? Time posted? Do more of what works.
Find Your Best Posting Times
Track what time you post and correlate with engagement. If 9am posts consistently outperform 3pm posts, adjust your schedule.
For general guidance, see our best times to post on Bluesky.
Identify Content Gaps
What topics get low engagement? Either you haven't found the right angle, or your audience doesn't care about that topic. Test different angles before abandoning topics entirely.
Set Realistic Goals
Based on your data, set achievable targets:
- "Grow followers by 15% this month"
- "Achieve 5%+ engagement rate on all posts"
- "Post 5x per week consistently"
Track progress against these goals.
See It in Action
This is what scheduling a Bluesky post looks like in Schedulala
Analytics Limitations to Accept
Some things you can't measure on Bluesky (yet):
Impressions: You don't know how many people saw your post. Focus on engagement instead.
Click-throughs: No native link click tracking. Use UTM parameters and check your website analytics.
Audience demographics: No data on who your followers are. Review profiles manually for qualitative insights.
Competitor data: Limited ability to see others' detailed performance.
Accept these limitations and focus on what you CAN measure.
Frequently Asked Questions
Does Bluesky have analytics?
Bluesky has basic post-level stats (likes, replies, reposts) but no comprehensive analytics dashboard. Third-party tools and manual tracking fill the gap.
What's the best Bluesky analytics tool?
Fedica offers the most comprehensive Bluesky analytics currently. For free options, manual tracking with a spreadsheet works well.
How do I track follower growth on Bluesky?
Manually record your follower count weekly in a spreadsheet. Over time, you'll see growth trends.
What's a good engagement rate on Bluesky?
3-6% is good, 6%+ is excellent. Bluesky engagement rates tend to be higher than Twitter due to smaller, more active audiences.
Will Bluesky add better analytics?
Likely, as the platform matures. For now, the focus is on core features. Third-party tools are filling the analytics gap.
How often should I check my analytics?
Weekly for basic tracking, monthly for deeper review. Don't obsess daily — it's a distraction.
Start Tracking Today
You don't need perfect analytics to improve. Start simple:
- Record your follower count weekly
- Note engagement on your posts
- Review monthly for patterns
- Adjust your content based on data
This basic system will put you ahead of most Bluesky users who post blindly and hope for the best.
For now, focus on what you can control: creating great content and posting consistently.
Try Schedulala for free
Schedule posts to Bluesky, Twitter, and 8 other platforms from one dashboard.
Get started for free→