Cross-Platform Analytics: Track 9 Platforms in One Dashboard
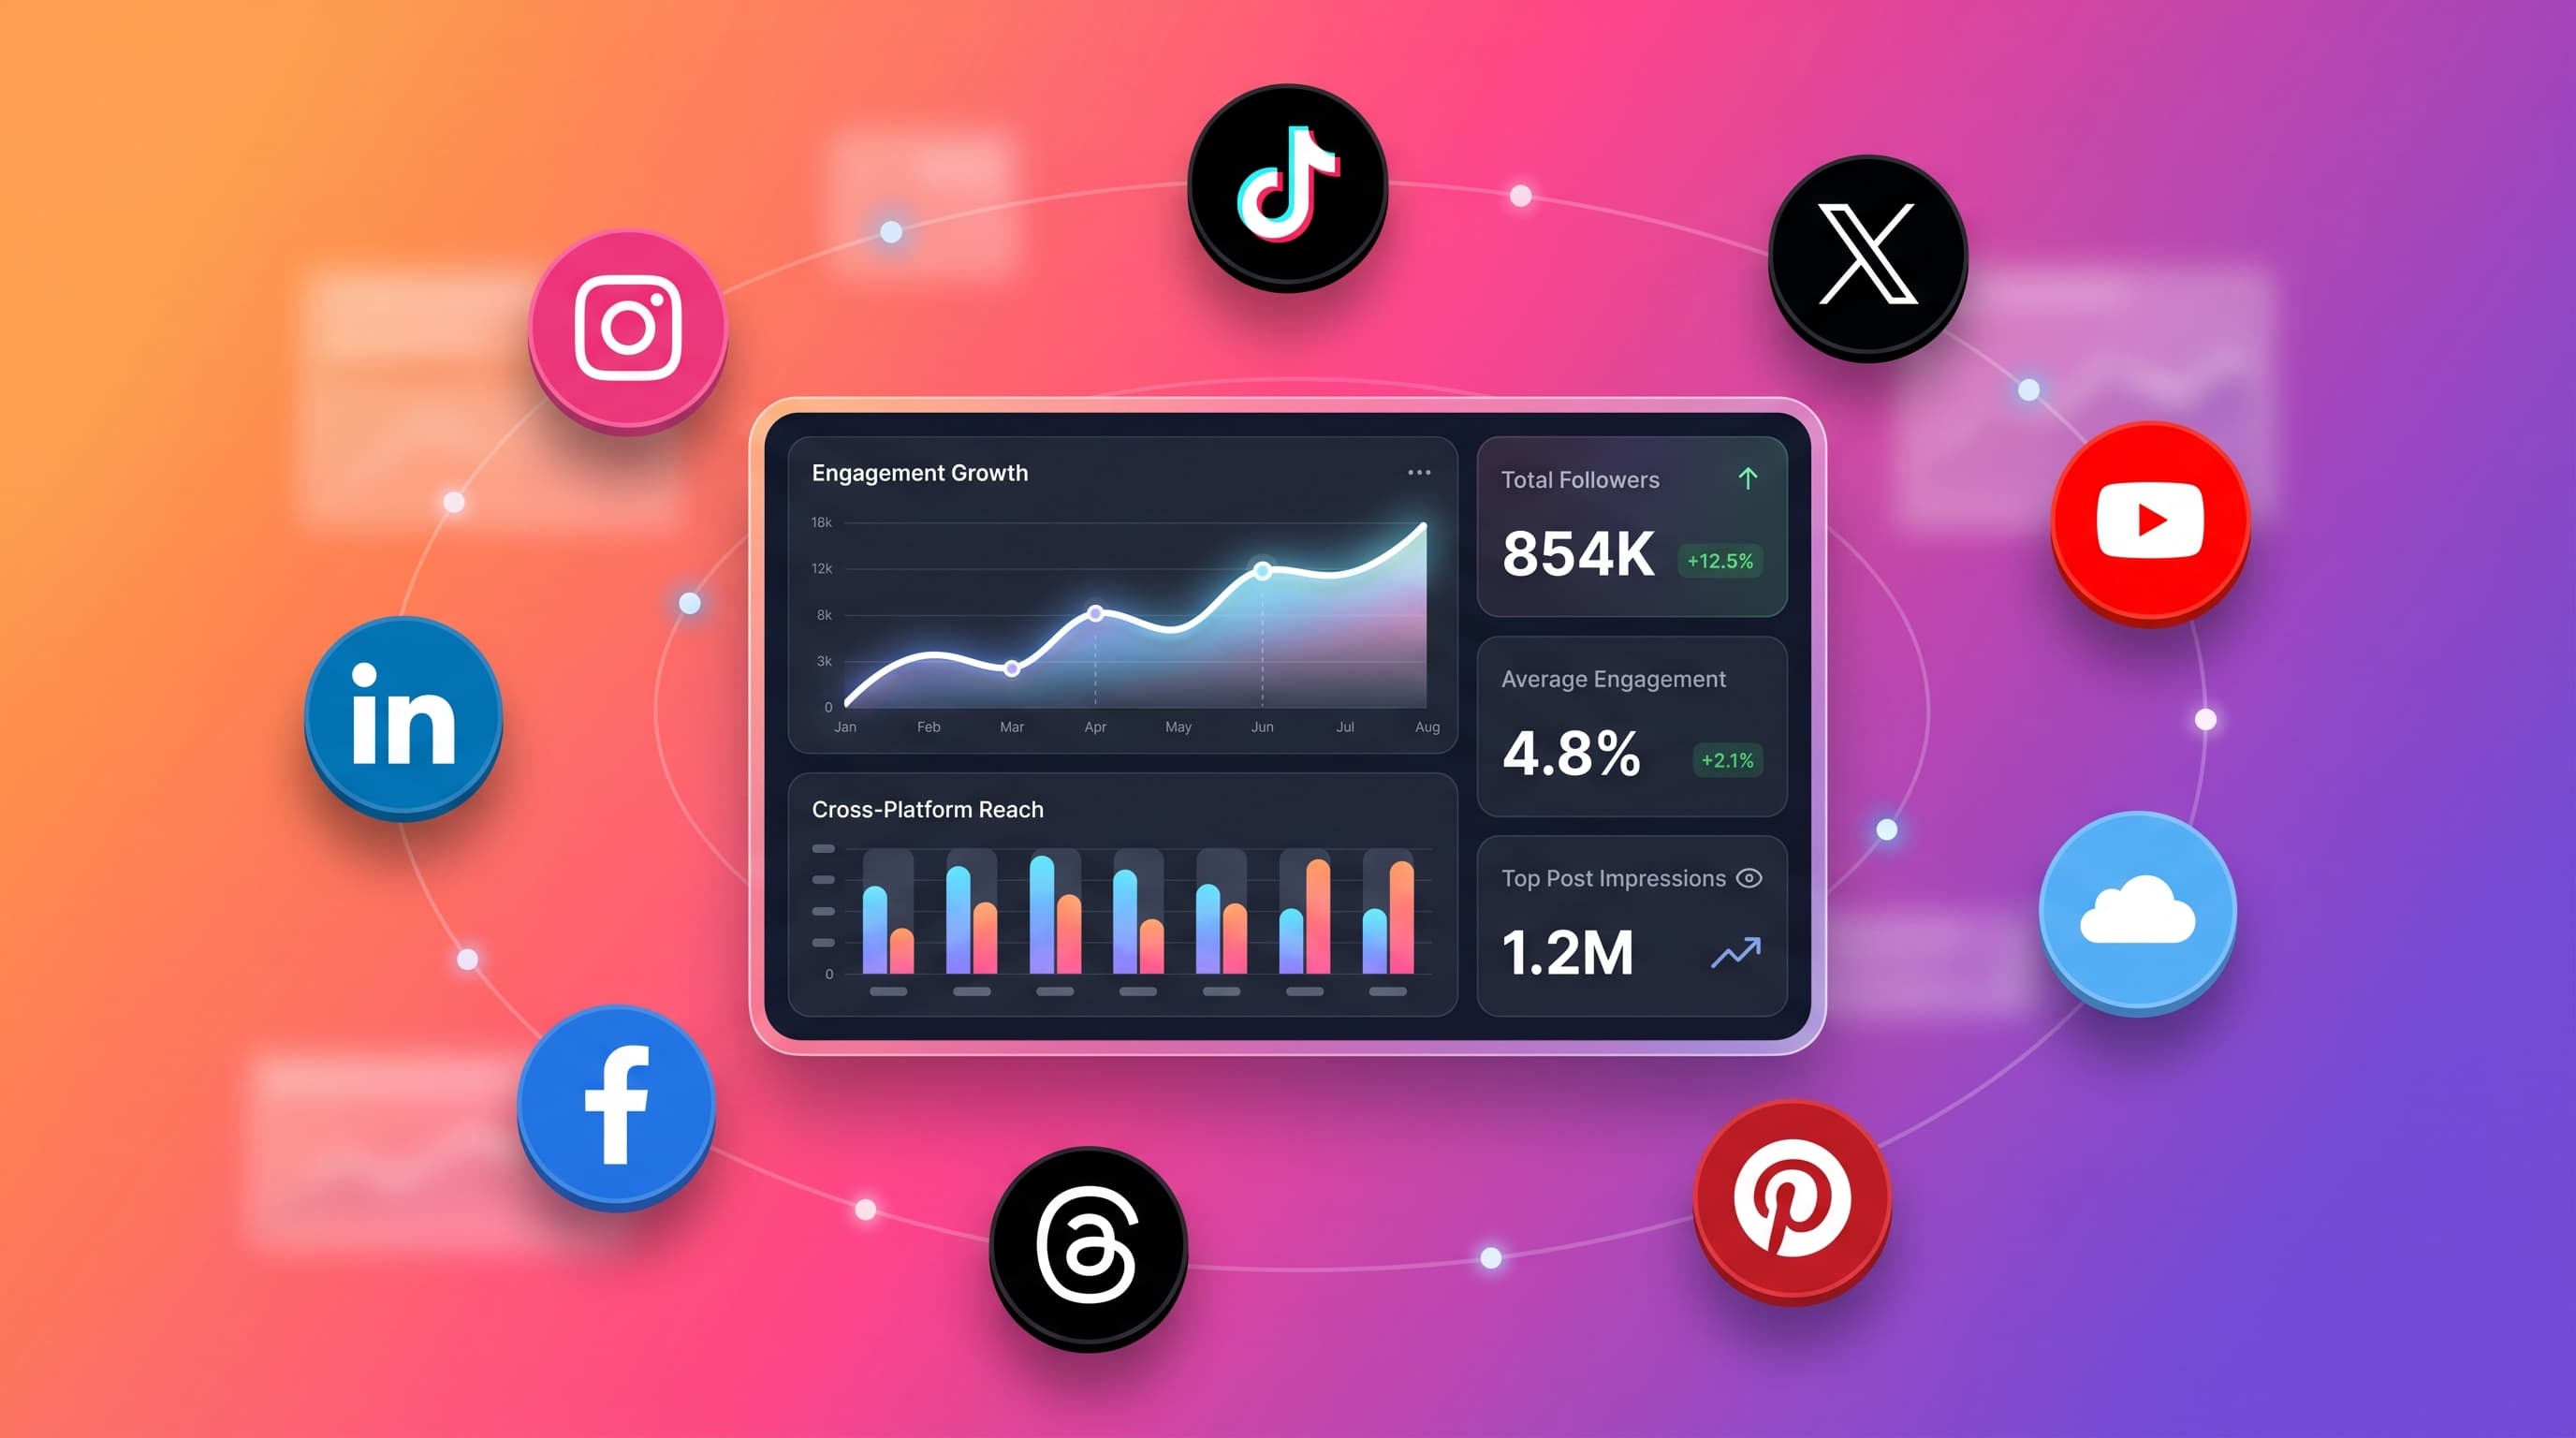
Schedulala just launched unified analytics across Instagram, TikTok, X, LinkedIn, YouTube, Facebook, Threads, Bluesky, and Pinterest. One dashboard, one daily sync.
Quick answer
Schedulala's Analytics tab now tracks 9 platforms in a single dashboard with daily auto-sync — no more flipping between native analytics tabs.
- •Unified All Platforms view aggregates followers, engagement, and top posts across every connected account
- •Per-platform tabs surface the killer metrics each platform actually rewards (saves on Instagram, retention on YouTube, profile visits on LinkedIn)
- •Daily snapshots populate growth charts and best-time-to-post recommendations
- •Available on Team ($18/mo) and Agency ($27/mo) plans, no add-on fees
Most social media schedulers let you post to 10 platforms but only show analytics for 2 or 3. The rest you have to dig out of each platform's native dashboard, one at a time, every week.
That's the gap we just closed.
Today Schedulala Analytics is live across 9 platforms in one dashboard: Instagram, TikTok, X (Twitter), LinkedIn, YouTube, Facebook, Threads, Bluesky, and Pinterest.
Try Schedulala for free
Schedule posts to Bluesky, Twitter, and 8 other platforms from one dashboard.
Get started for free→What's new
Three things shipped together:
1. The All Platforms tab
A unified view across every platform you connect. Total followers, total engagement, top posts ranked across all networks, posting patterns aggregated by day-of-week and hour. If you manage a brand on 5 networks, this is the tab you'll open first every morning.
See It in Action
The All Platforms tab — total followers, total engagement, top posts ranked across every platform you connect
2. Per-platform tabs that respect each platform's killer metric
Generic analytics shows you "likes." Useful, but every platform rewards something different. We built each tab around the metric that actually drives growth on that platform:
- Instagram — saves and reach (the algorithm signals)
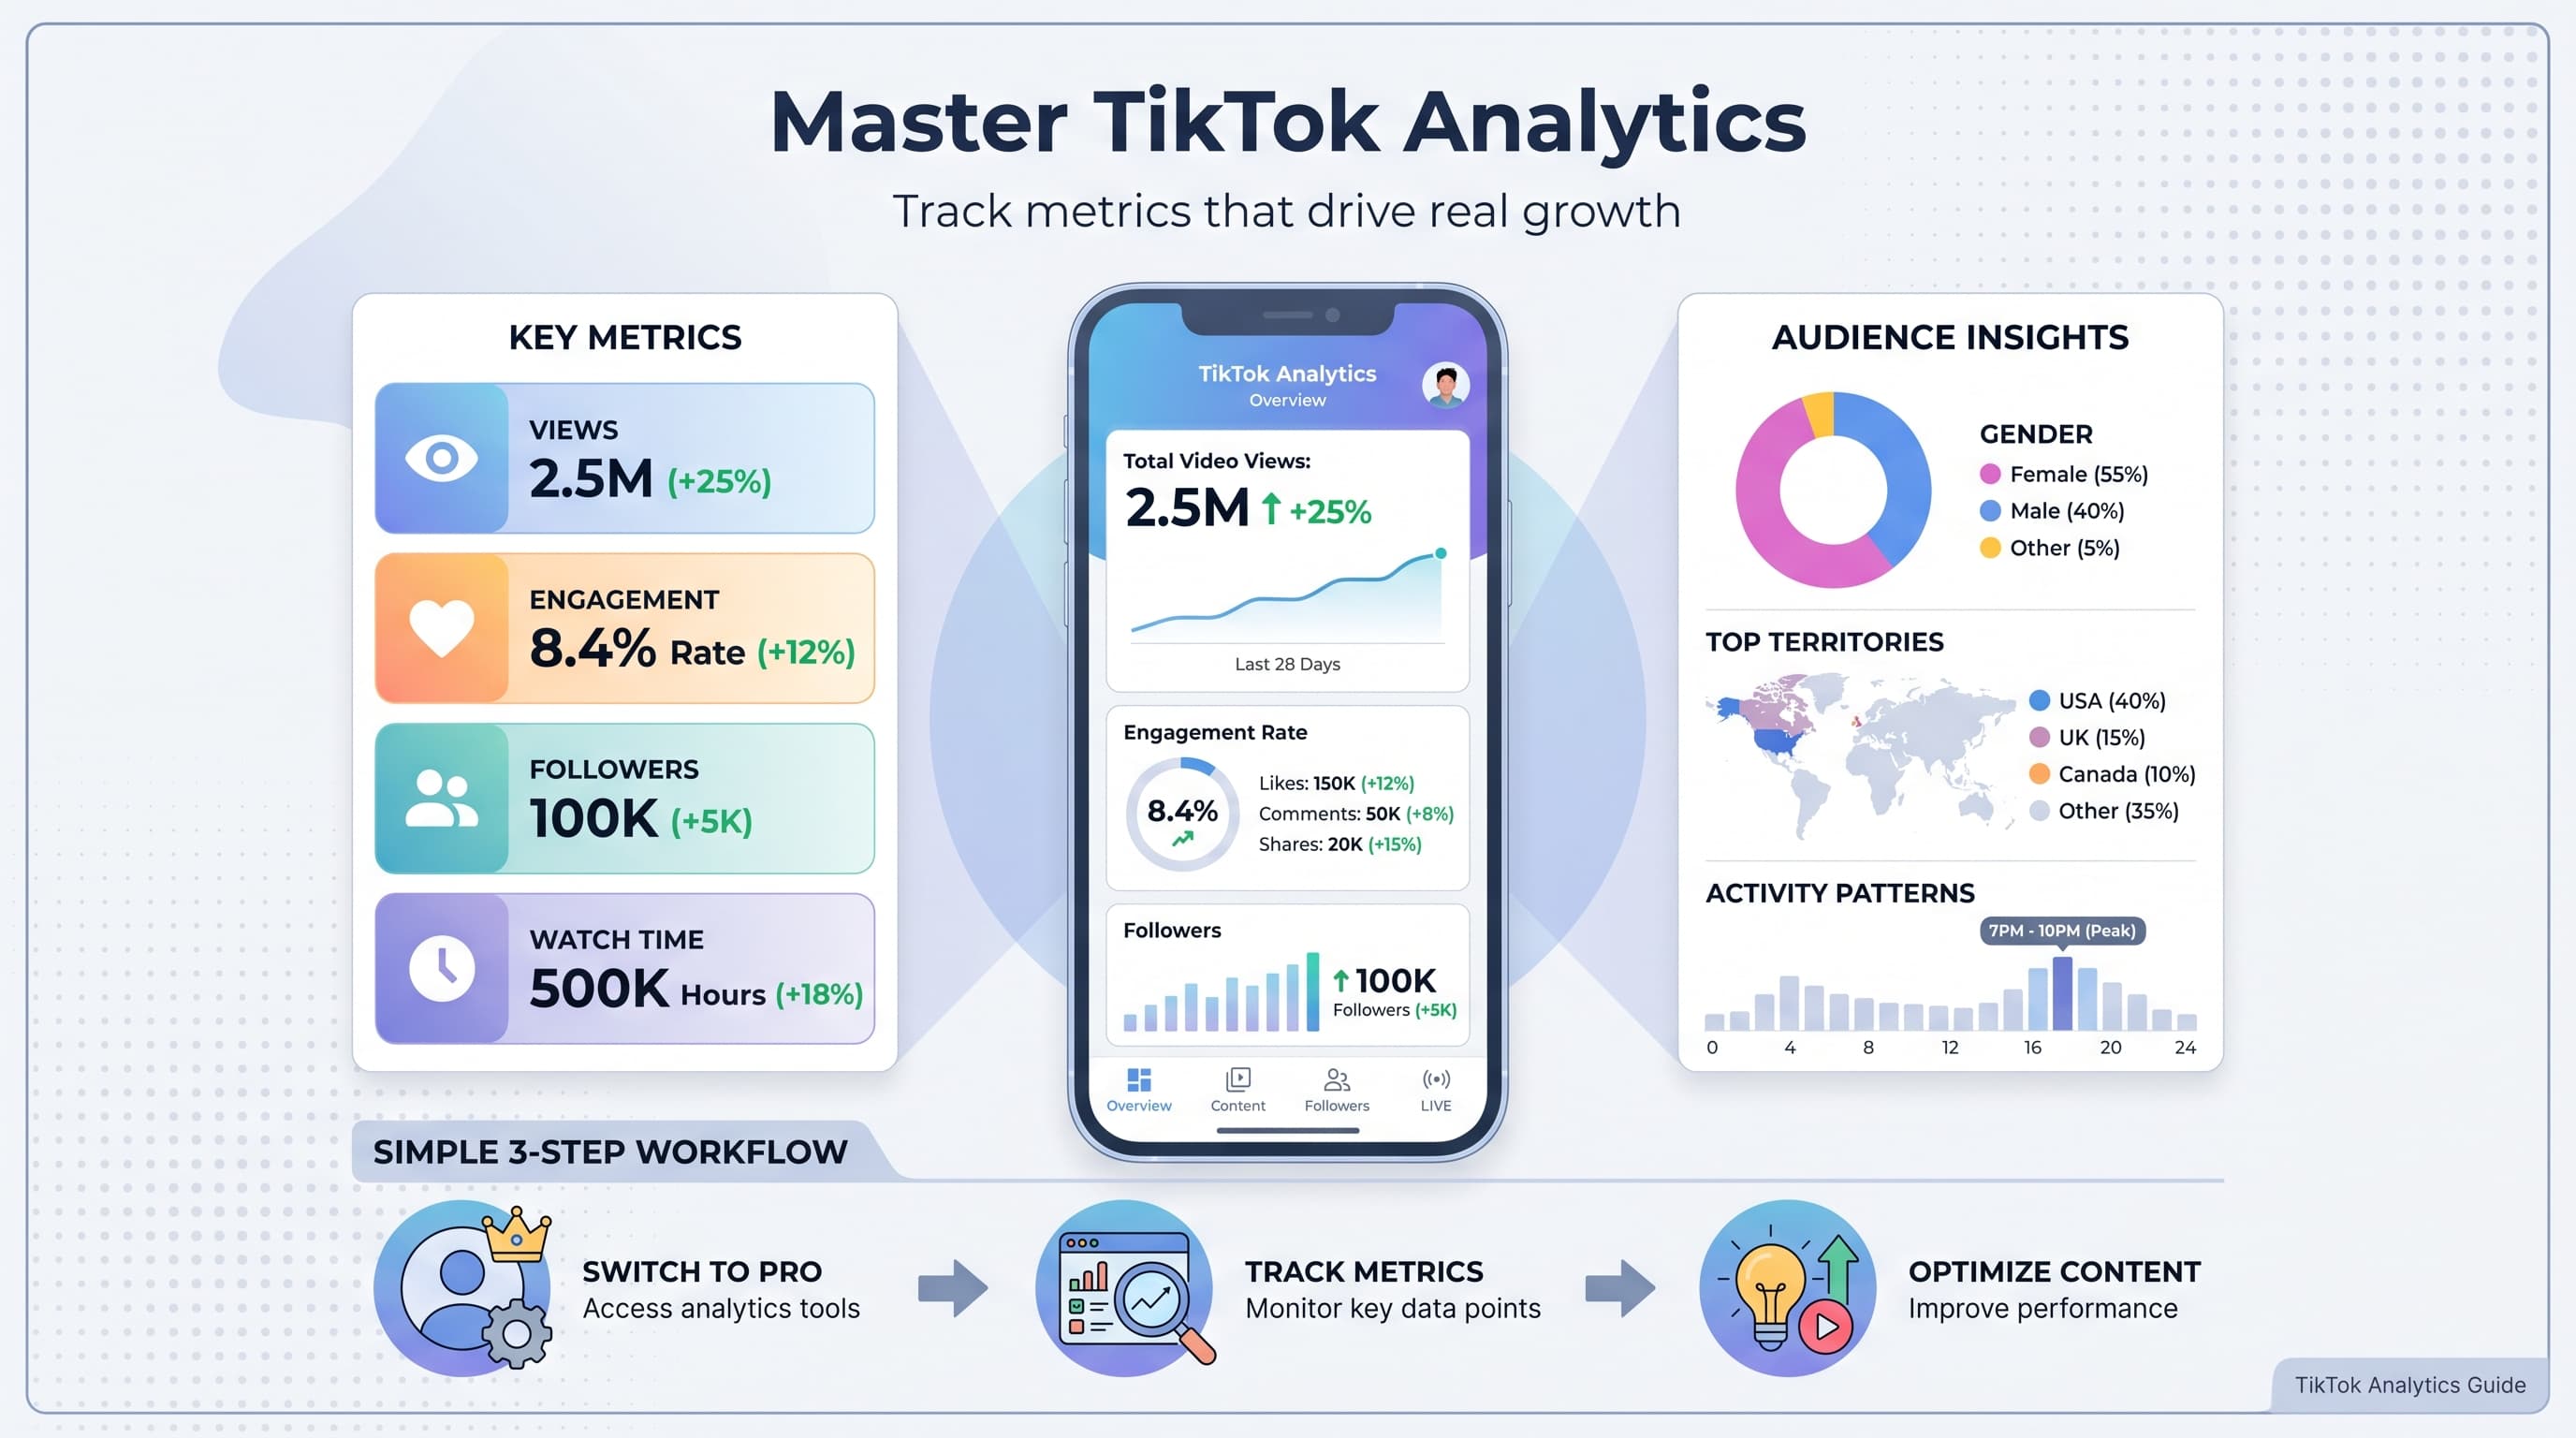
- TikTok — average watch time and completion rate (FYP signals)
- YouTube — average view duration, watch time, click-through rate
- LinkedIn — impressions, profile views, demographics
- X (Twitter) — impressions, profile visits, bookmarks
- Pinterest — monthly views, save rate, outbound clicks
- Facebook — page reach, page views, 6-emoji reaction breakdown
- Threads — views, replies, repost rate
- Bluesky — engagement heatmap, posting streak, best day-of-week
See It in Action
The YouTube tab — retention, watch time, and click-through rate front and center
3. Daily auto-sync, no manual refresh
Every connected account gets a daily snapshot — that's how the growth charts have something to show, and how "best time to post" learns from your actual data instead of generic advice. The first time you click Analytics after connecting a platform, your data populates in about 30 seconds. After that it updates on its own.
Why this is different
Most schedulers treat analytics as an afterthought. The few that take it seriously charge $99-499/month for it as a separate tier (looking at you, Hootsuite Insights).
Schedulala Analytics is included in the Team plan at $18/month. Same plan, no add-ons.
If you're managing content on 5+ platforms, opening 5+ native dashboards every Monday morning, your analytics workflow takes 30-45 minutes. The All Platforms tab does it in 30 seconds.
What's tracked, per platform
Followers and audience
Daily follower count for every platform that exposes it (8 of 9). Growth charts show week-over-week and month-over-month trends — the kind of data the native dashboards usually only show as "current count" without history.
Engagement
Likes, comments, shares, reposts, replies — normalized into a single engagement score per post and per account. You can see which posts performed best across all platforms, ranked together.
Reach and impressions
For platforms that expose it: Instagram, X, LinkedIn, YouTube, Facebook, Pinterest, Threads. Tells you how far your content actually traveled, not just how many people clicked.
Best time to post
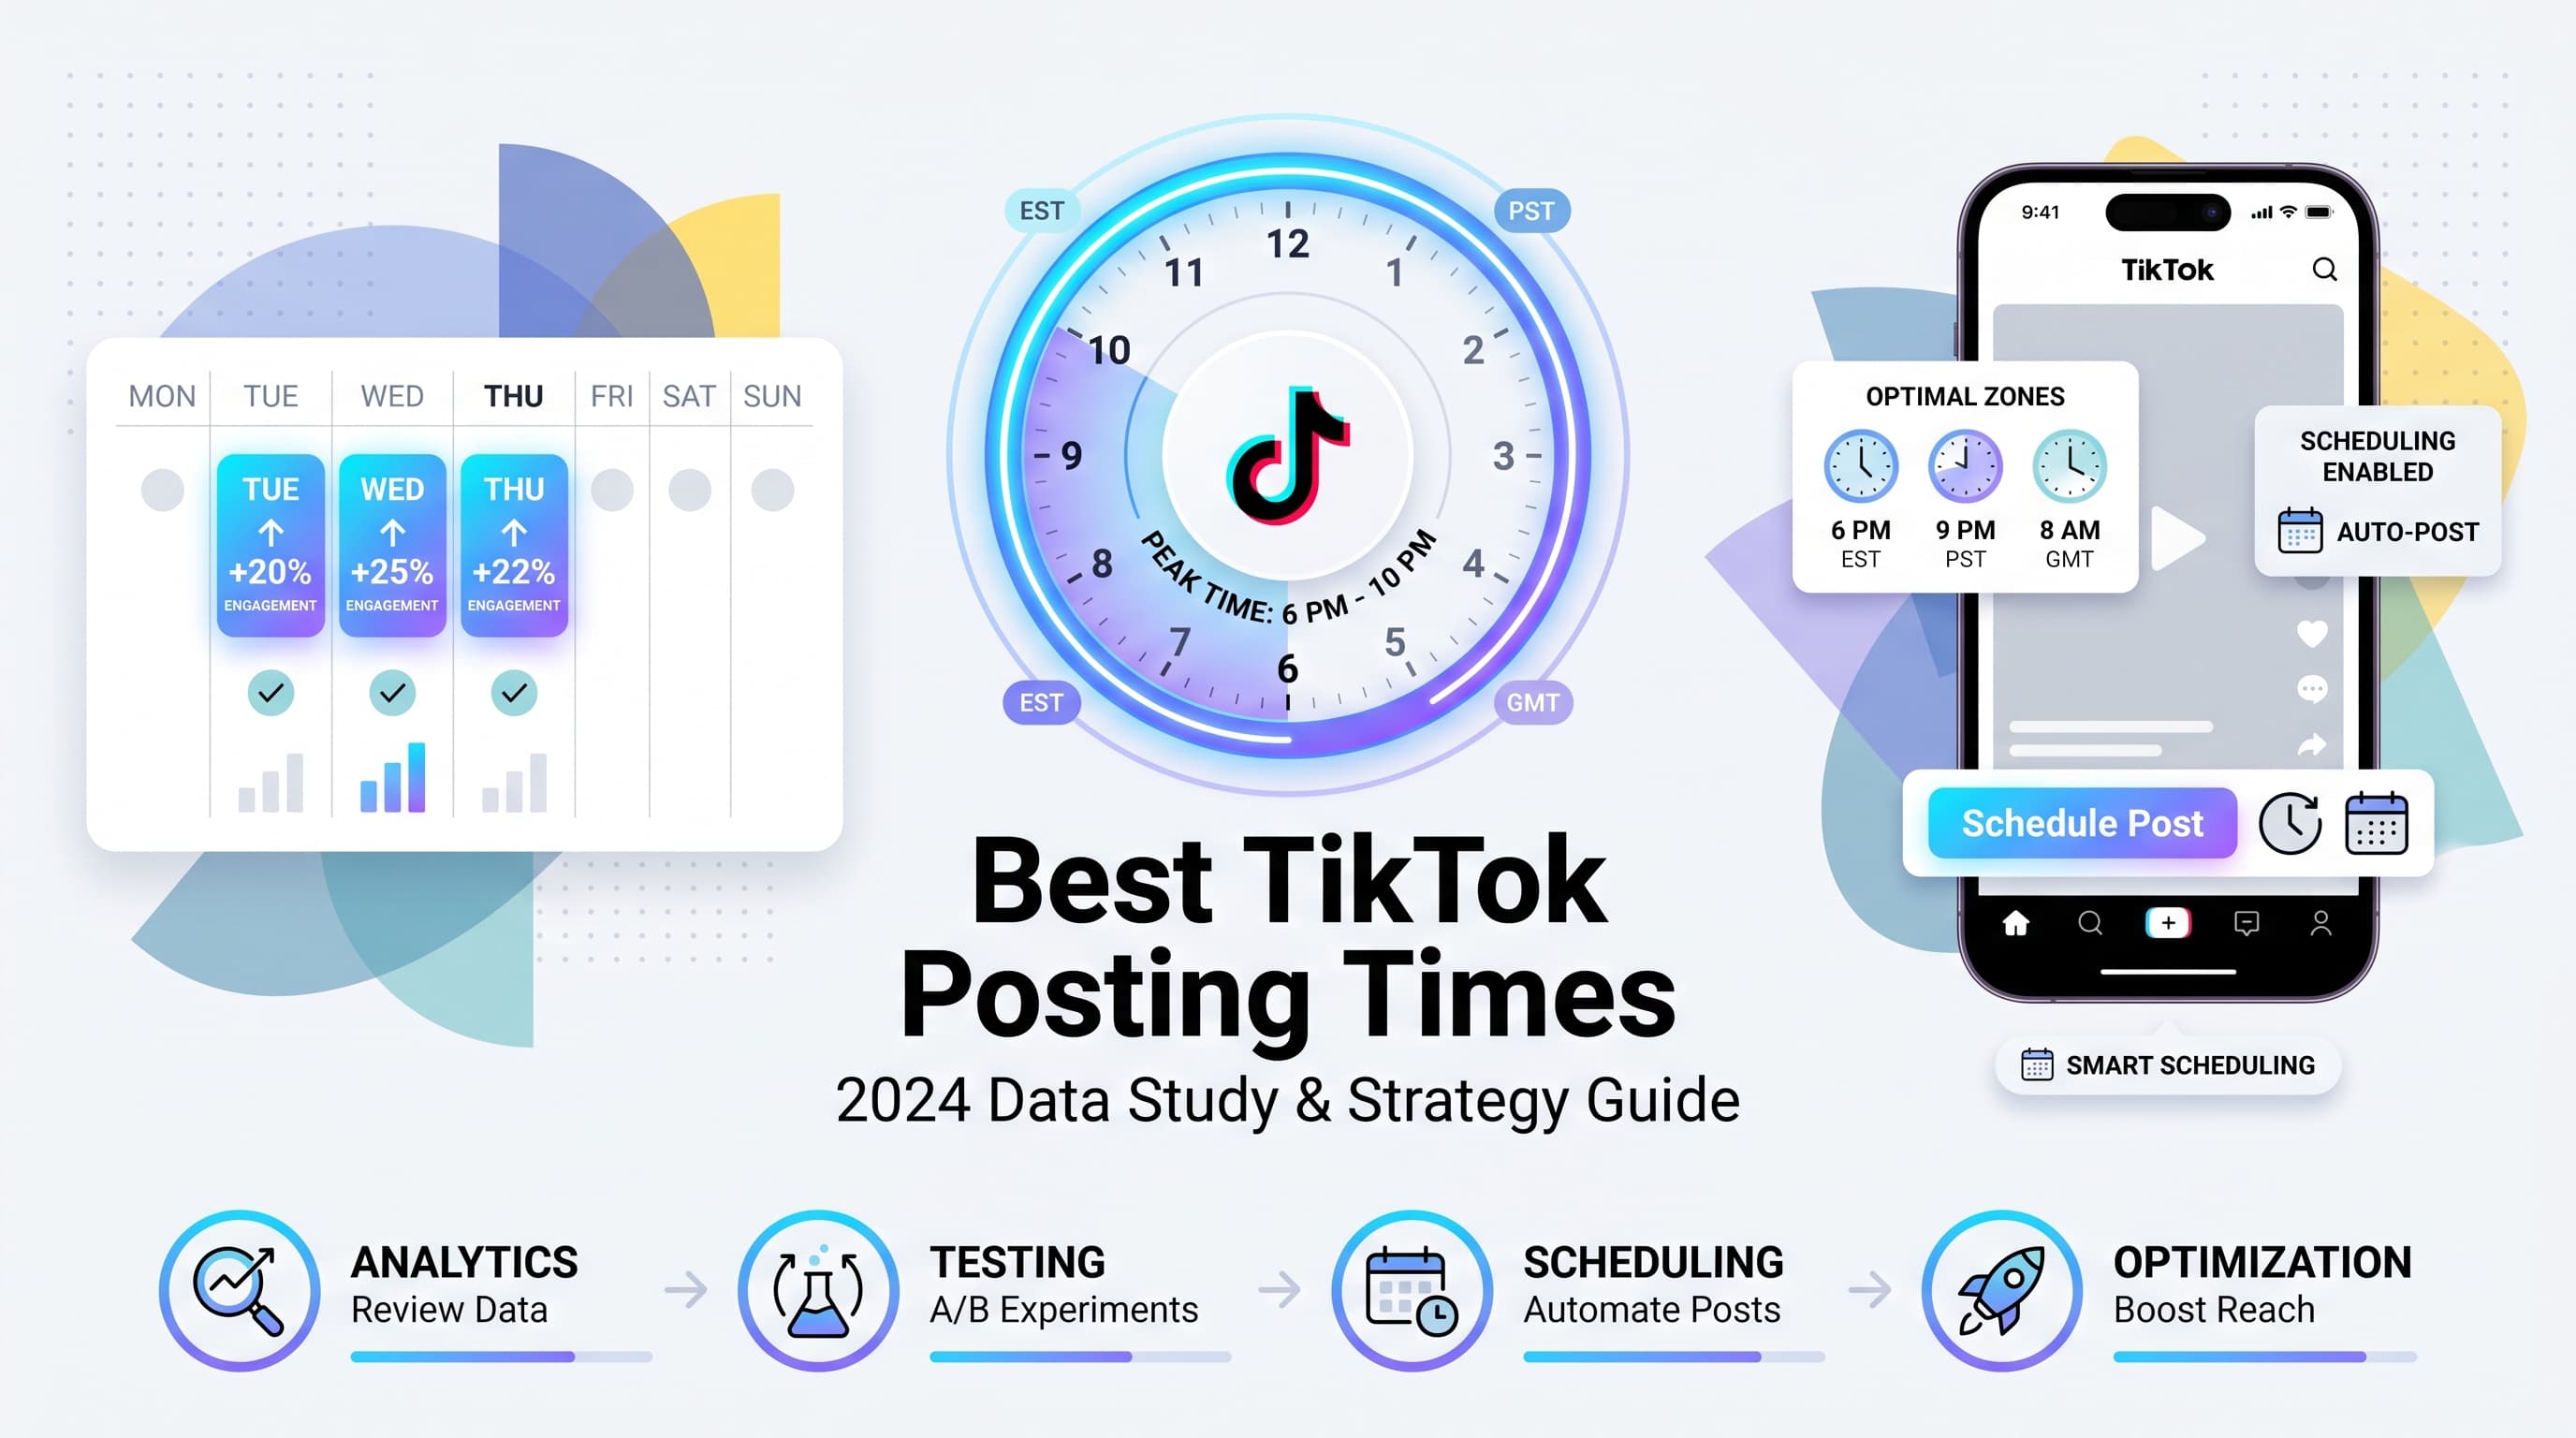
Calculated from your actual engagement data, per platform. Generic advice ("post at 9am Tuesday!") rarely matches what your specific audience does — your best time on TikTok is probably very different from your best time on LinkedIn.
Top performing posts
Ranked by engagement, with platform-specific context (a post that drove 500 saves on Instagram is the equivalent of 50K impressions on X). Helps you spot patterns in what works.
See It in Action
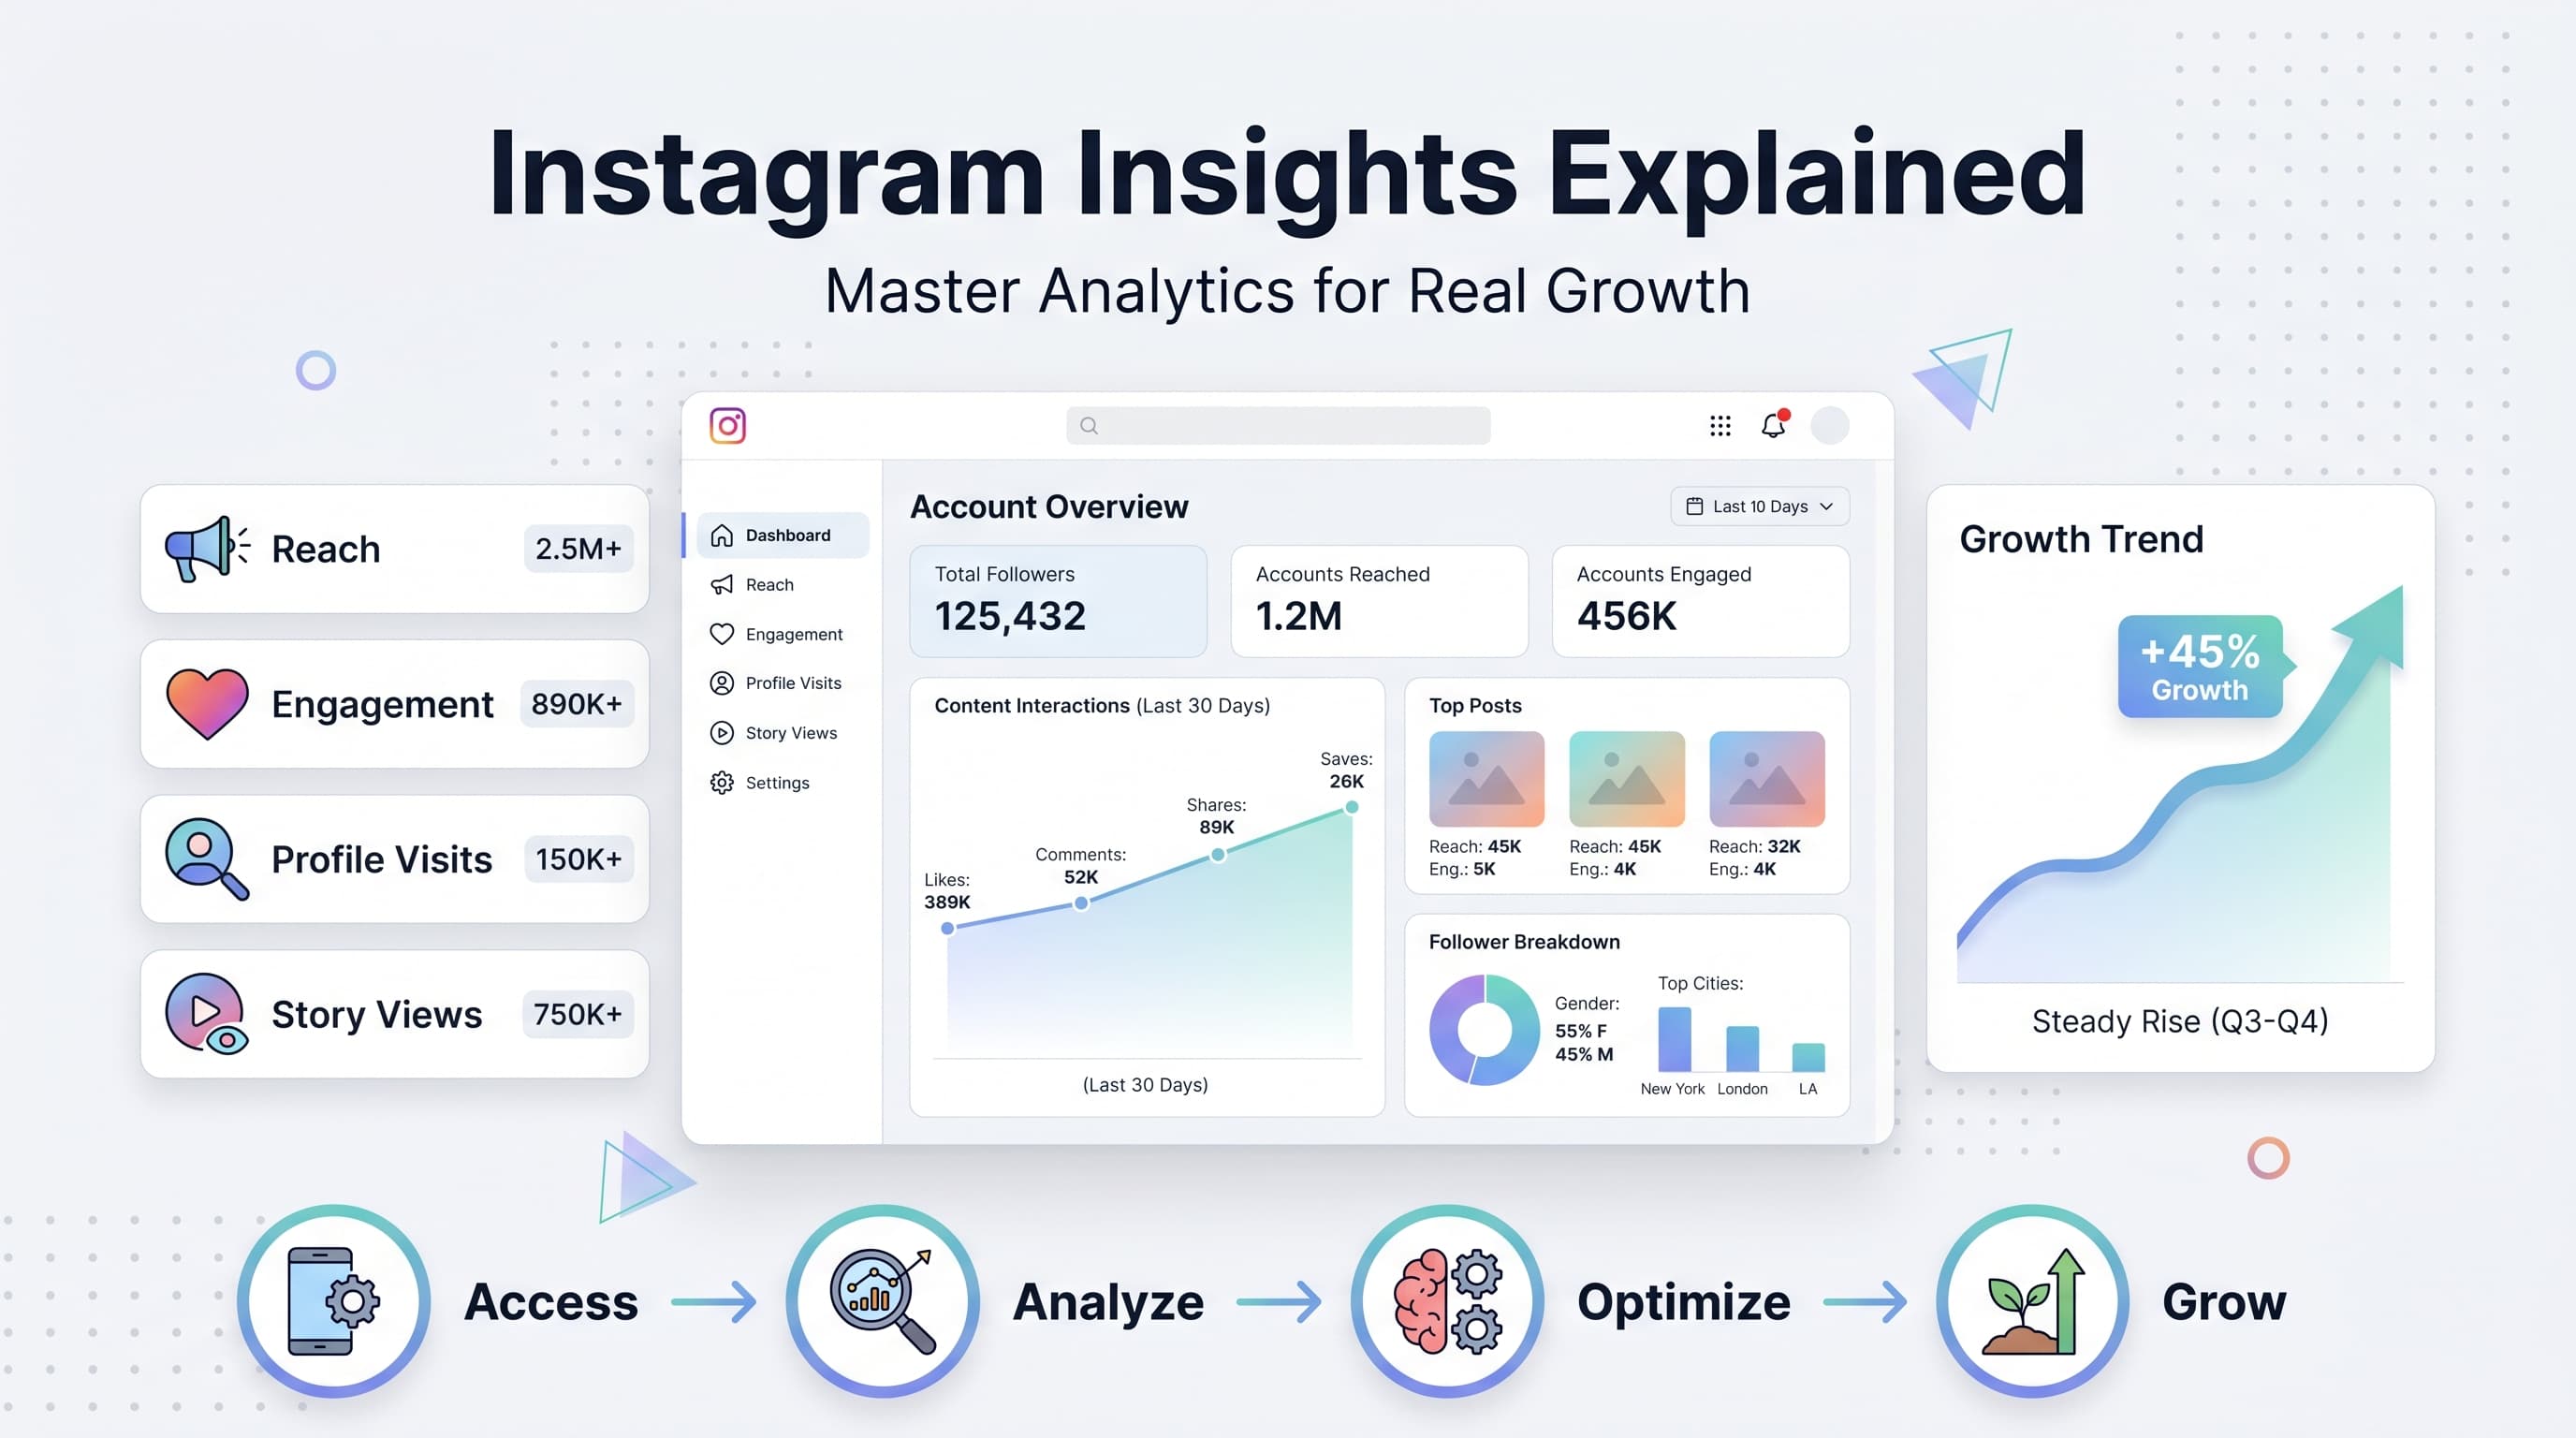
The Instagram tab — saves, reach, profile visits, and engagement rate
What's not included (yet)
We'd rather be specific about gaps than oversell. Three things are missing from this launch:
- Telegram analytics — channel-style platforms don't expose the engagement metrics our system aggregates around. We're researching whether view counts alone are enough to justify a stripped-down tab.
- CSV/PDF export — TikTok has it; the other 8 platforms will get export in the next 1-2 weeks. PDF reports for clients are scoped for the Agency plan.
- Audience demographics on platforms beyond LinkedIn — Instagram and Facebook expose this via Insights API but we haven't surfaced it yet. On the roadmap.
How to get started
If you're on the Team or Agency plan, you already have access. Open your dashboard and click the Analytics tab in the sidebar. The All Platforms view is the default if you have multiple platforms connected.
If you're on Personal, you'll see a preview with an upgrade option. The preview shows your real data behind a soft-blur — you can see your numbers without committing.
9 platforms, one dashboard, daily auto-sync, no manual refresh. Available now on Team and Agency. The thing every multi-platform creator has been asking for — and the workflow that turns "I post on 5 networks but I have no idea what's working" into "I know exactly what's working."