TikTok Analytics: Understanding Your Metrics for Better Performance in 2026
Master TikTok analytics with our complete guide. Learn to track views, engagement, audience insights, and growth metrics for better content strategy.
Your TikTok videos are getting views, but you have no idea what's actually working. Sound familiar? Learn more about TikTok scheduling.
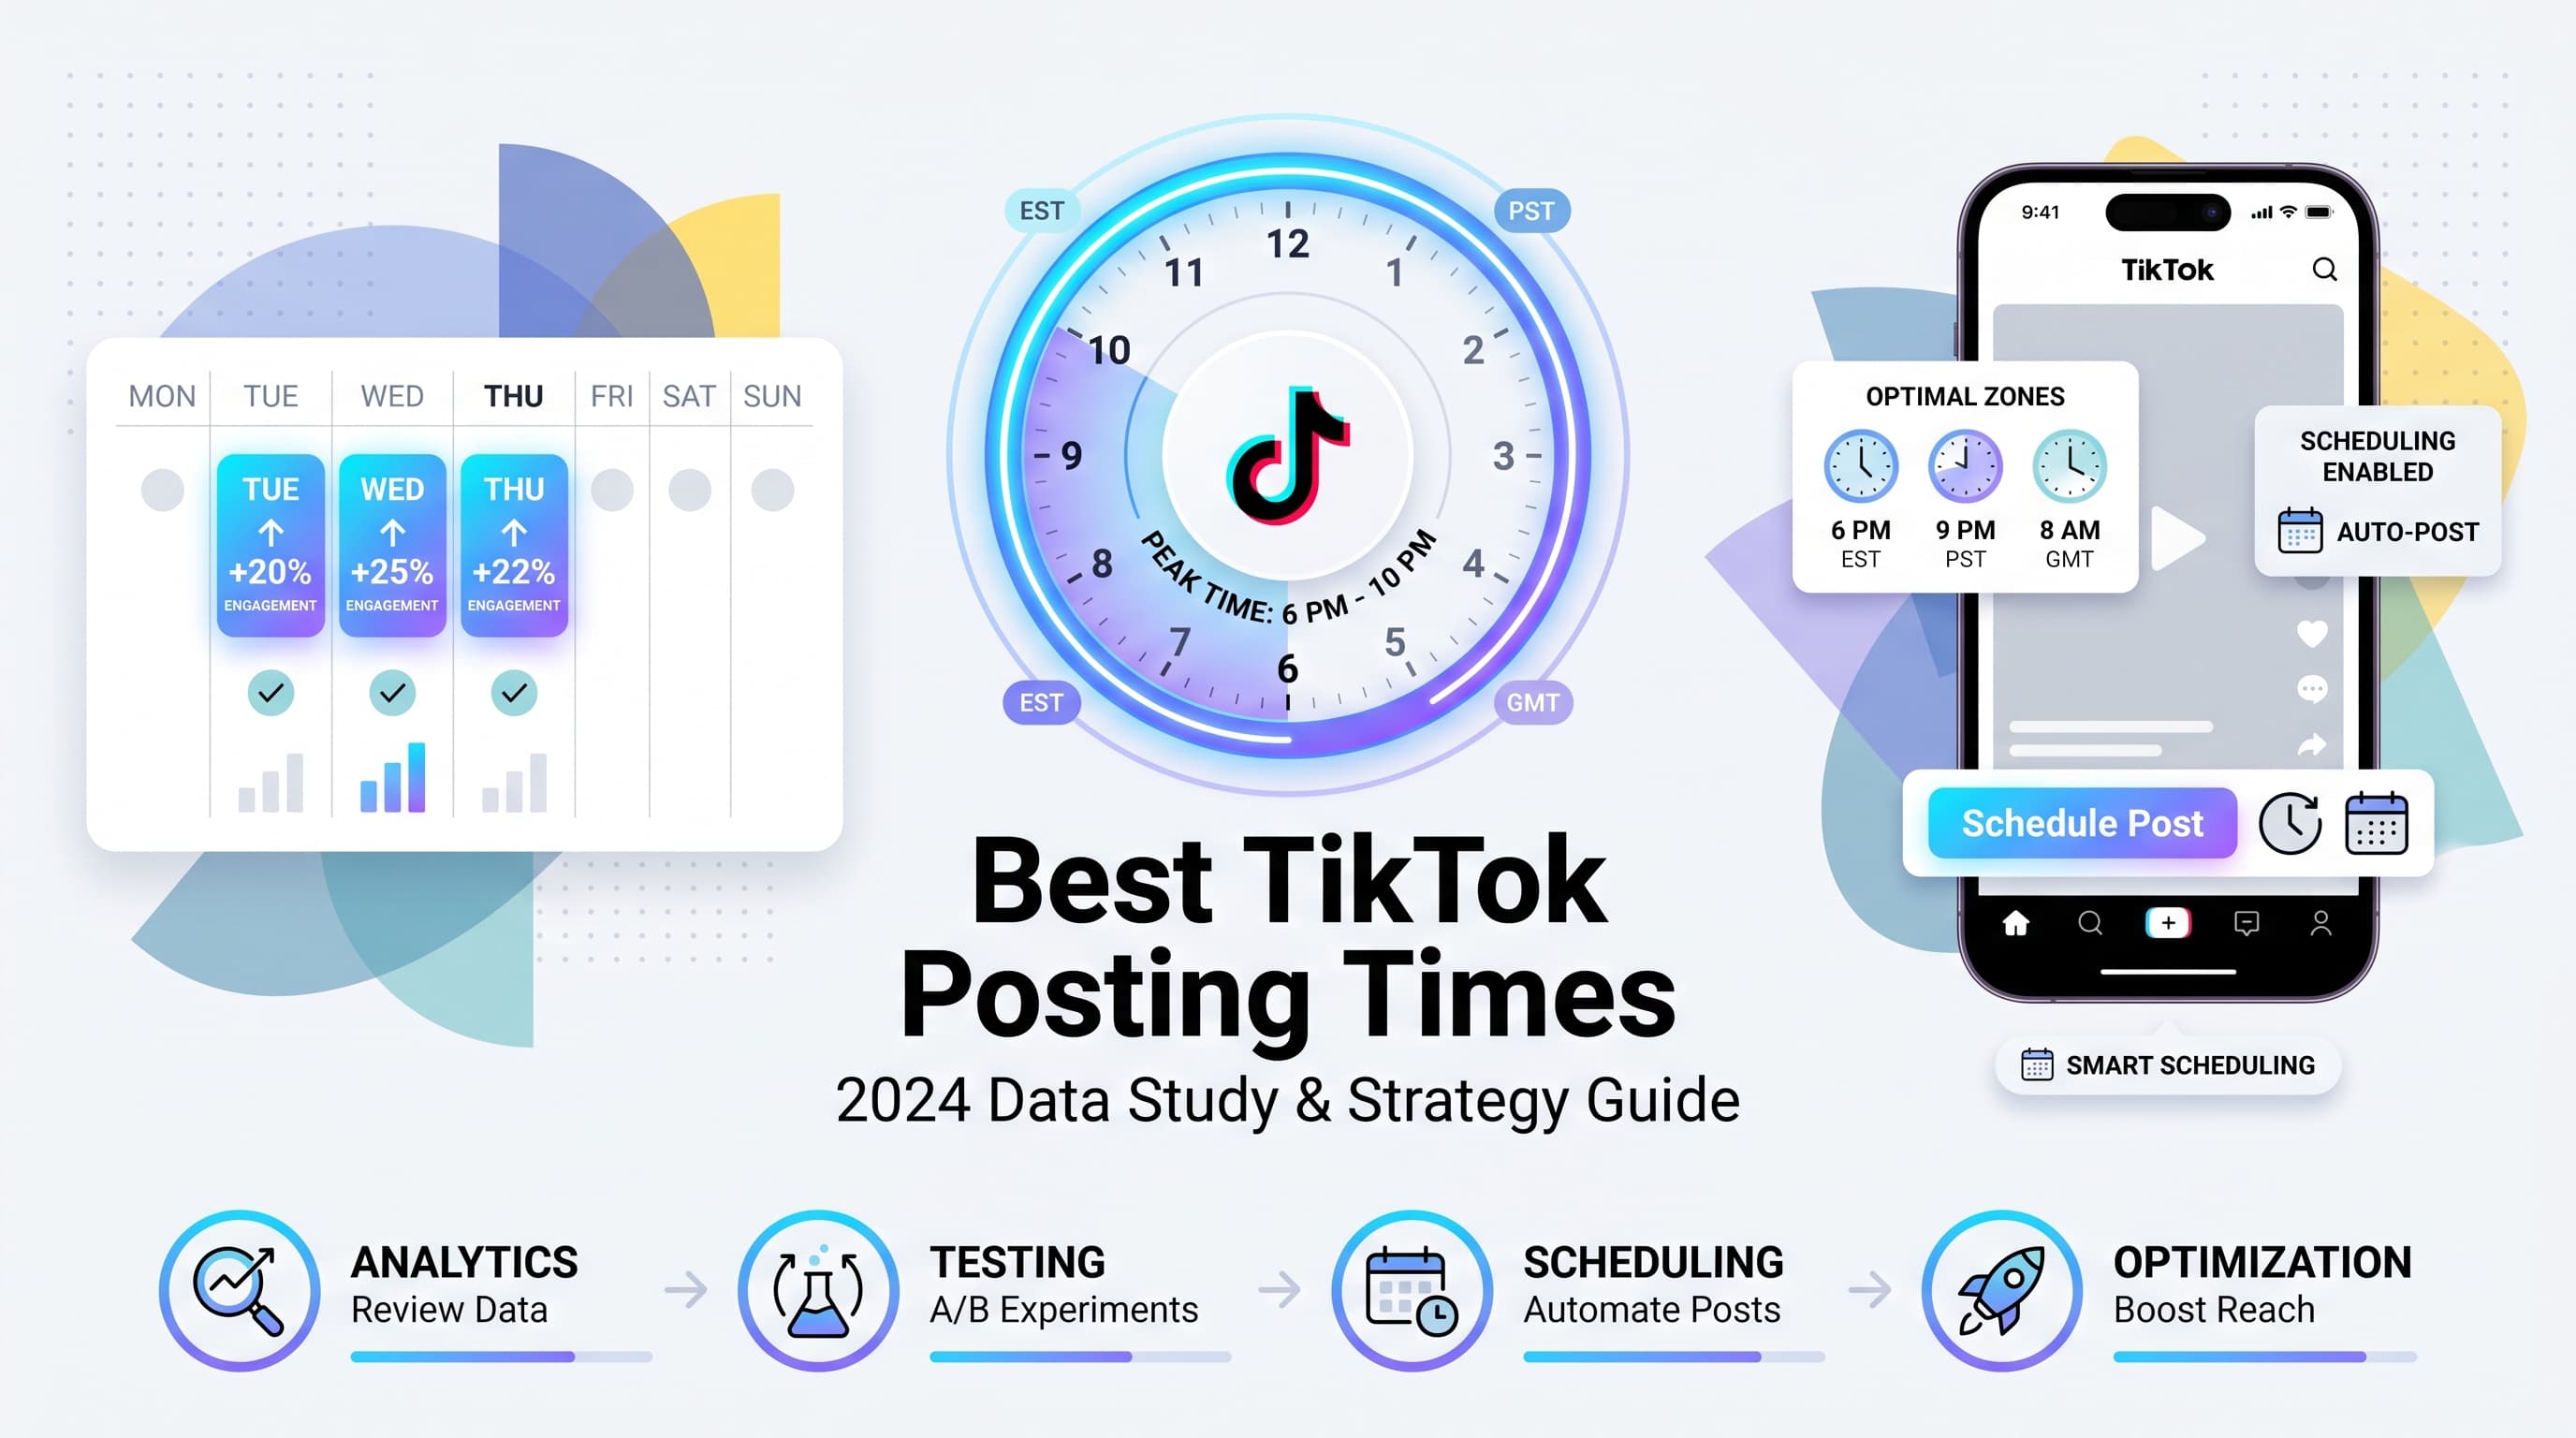
See It in Action
This is what scheduling a TikTok post looks like in Schedulala
TikTok analytics can feel like reading hieroglyphics if you don't know what you're looking for. But here's the thing: understanding your metrics is the difference between randomly posting content and building a strategy that actually grows your following and engagement. Our cross-platform analytics track 9 can help.
Try Schedulala for free
Schedule posts to Bluesky, Twitter, and 8 other platforms from one dashboard.
Get started for free→What are TikTok analytics and why they matter
TikTok analytics are the data points that show you how your content performs on the platform. Think of them as your content report card, but way more useful than any grade you got in school. Learn more about scheduling across platforms.
These metrics tell you everything from how many people watched your videos to when your audience is most active online. The catch? TikTok only gives you access to these insights if you have a Pro Account (which is free to switch to). Our ai social media post can help.
1. Video metrics
Every video you post generates its own set of performance data. This includes views, likes, shares, comments, and how long people actually watch your content. Video metrics help you identify which content formats and topics resonate most with your audience. Learn more about best time to post on tiktok.
The most important metric here isn't total views (though that feels good). It's average watch time and completion rate. TikTok's algorithm heavily weights these engagement signals when deciding whether to push your content to more people. Learn more about tiktok engagement calculator.
2. Profile metrics
Your profile analytics show the bigger picture of your account growth. This includes follower count changes, profile views, and how people are finding your account. Are they discovering you through hashtags, the For You page, or your other social media?
Profile metrics reveal whether your content strategy is building long-term audience growth or just generating one-time views. A healthy TikTok account sees steady follower growth alongside consistent engagement rates.
3. Audience insights
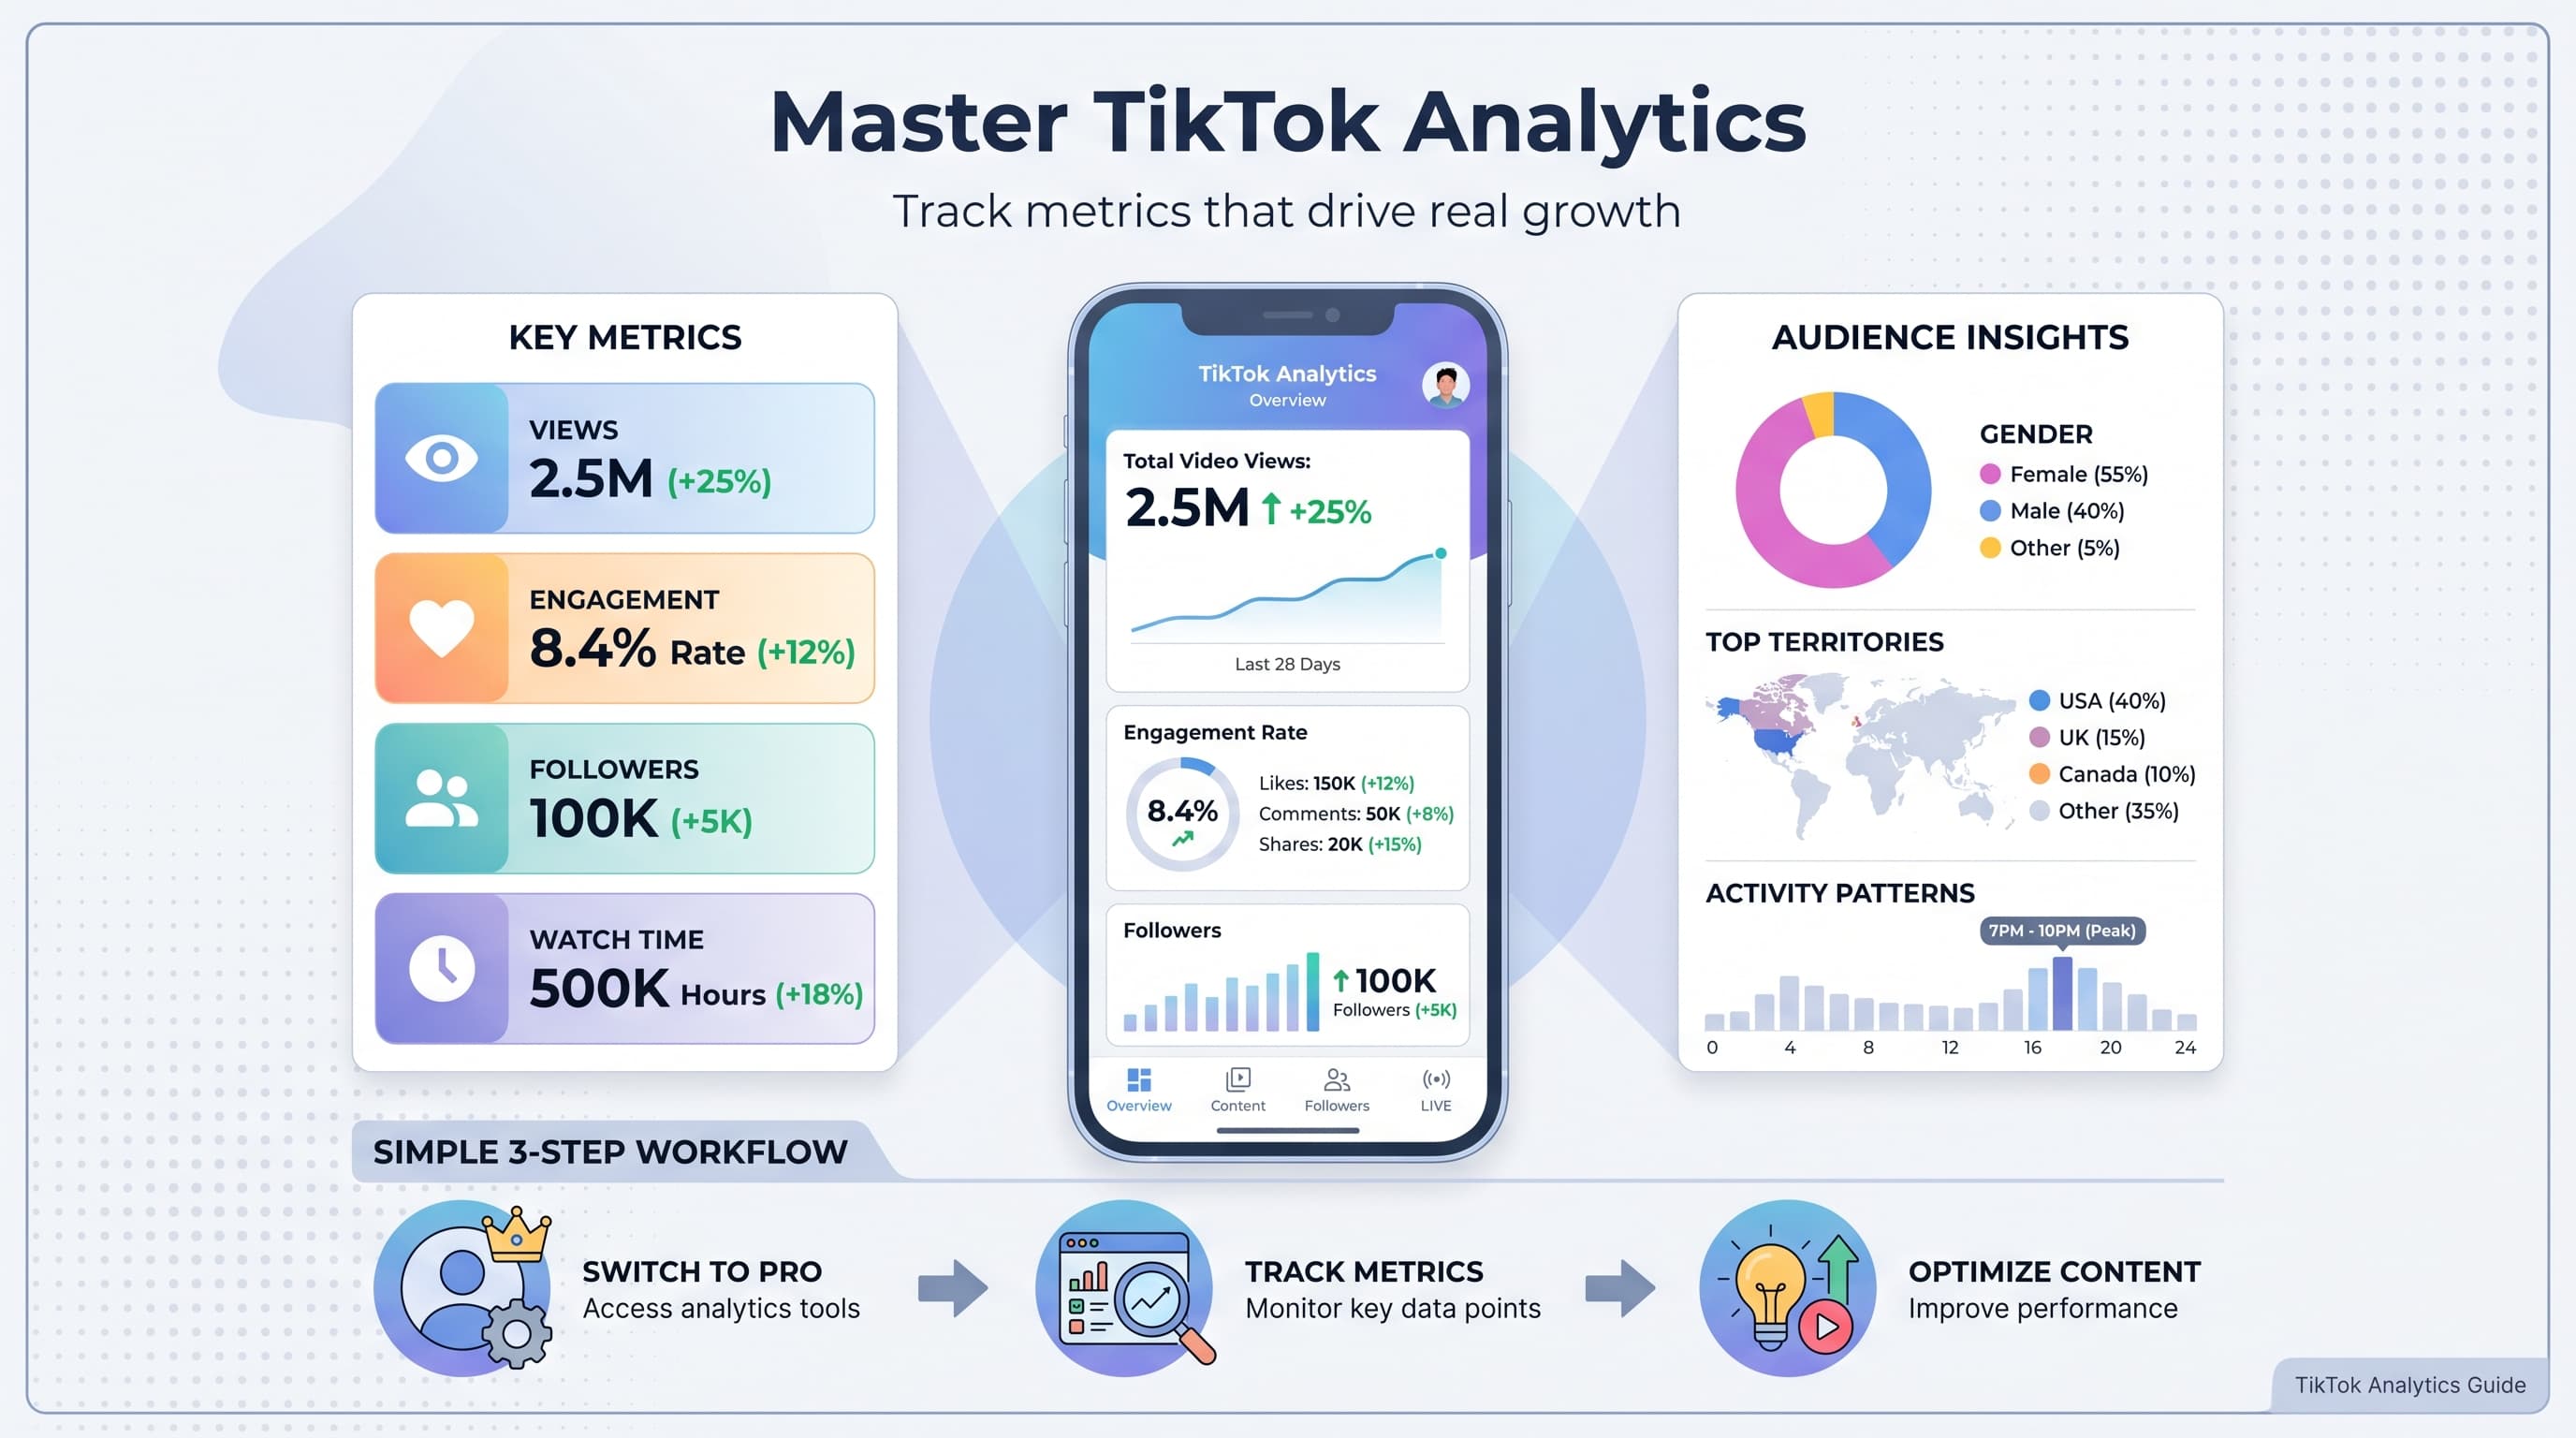
TikTok's audience insights break down who's actually watching your content. You'll see demographics like age, gender, location, and most importantly, when your followers are most active on the app.
This data is gold for content planning. If 70% of your audience is online between 7-9 PM on weekdays, that's when you should be posting. No more guessing games about optimal timing.
How to access TikTok analytics
Before you can dive into your data, you need to switch to a TikTok Pro Account. Don't worry, it's completely free and takes about two minutes.
Step 1: Switch to Pro Account
Open TikTok and go to your profile page. Tap the three lines in the top right corner, then select Settings and Privacy. Look for Account and tap Switch to Pro Account.
TikTok will ask you to choose between Creator or Business account. Pick Creator unless you're specifically running a business that needs advanced advertising features. The analytics are identical for both.
Step 2: Find your analytics
Once your Pro Account is active, go back to your profile. You'll now see an Analytics option in your settings menu. Tap it to access your dashboard.
The analytics dashboard has three main tabs: Overview, Content, and Followers. Each tab shows different aspects of your account performance over the last 7, 28, or 60 days.
Key TikTok metrics you should track
Not all metrics are created equal. Some numbers look impressive but don't actually help you grow. Here are the metrics that matter most for building a successful TikTok presence.
Views and impressions
Views count how many times people watched your video for at least one second. Impressions track how many times your video appeared on screens, even if people scrolled past it immediately.
A big gap between impressions and views usually means your thumbnail or opening hook isn't compelling enough to make people stop scrolling. This is your first optimization opportunity.
Good performance varies by account size, but generally aim for a view rate (views divided by impressions) of at least 20-30%. Viral content often sees view rates above 60%.
Watch time and completion rate
Average watch time shows how long people typically watch your videos. Completion rate tells you what percentage of viewers watch until the end. These are the metrics TikTok's algorithm cares about most.
TikTok wants to keep people on the app as long as possible. Videos that hold attention get pushed to more For You pages. Aim for average watch times of at least 50% of your video length.
Short videos (15-30 seconds) should have completion rates above 40%. Longer videos (60+ seconds) can perform well with completion rates around 20-30%, as long as the average watch time is high.
Engagement metrics
Likes, comments, shares, and saves show how actively your audience engages with your content. But not all engagement is equal. Comments and shares signal higher engagement to TikTok's algorithm than likes.
Calculate your engagement rate by adding all interactions and dividing by total views. A good engagement rate for TikTok is 3-9%. Accounts with highly engaged niche audiences often see rates above 10%.
Saves are particularly valuable because they indicate people want to reference your content later. How-to videos, recipes, and educational content typically generate the most saves.
Follower growth rate
Track how many new followers you gain relative to your total follower count. A healthy growth rate for established accounts is 2-5% monthly. New accounts can often achieve much higher rates initially.
Pay attention to follower retention too. If you gain 100 followers but lose 80, your net growth is only 20. Consistent, valuable content helps reduce follower churn.
Quality beats quantity. 1,000 engaged followers who regularly interact with your content are worth more than 10,000 passive followers who never engage.
Understanding your audience insights
TikTok's audience insights reveal who's watching your content and when they're most active. This data helps you create content that resonates and post when your audience is actually online.
Demographics breakdown
The Followers tab shows your audience's age ranges, gender split, and top locations. This demographic data should align with your content strategy and target audience.
If you're creating content for young adults but your analytics show mostly 35+ viewers, you might need to adjust your content style, hashtags, or posting strategy. Demographic misalignment often indicates your content is reaching the wrong audience.
Geographic data helps with content timing and localization. If most followers are in specific time zones, schedule posts for their peak hours rather than your local time.
Activity patterns
TikTok shows when your followers are most active by day of the week and hour of the day. This heat map is one of your most valuable analytics tools for optimizing posting times.
Don't just post during peak hours though. Sometimes posting during moderate activity periods can work better because there's less competition for attention in the algorithm.
Test posting at different times and track performance. Your optimal posting schedule might be different from general TikTok best practices, especially if you serve a niche audience.
| Time Period | Best For | Typical Engagement |
|---|---|---|
| Peak Hours | Maximum reach | High competition |
| Moderate Hours | Better engagement rates | Less competition |
| Off-Peak Hours | Testing content | Lower reach but loyal audience |
Analyzing individual video performance
Every video tells a story through its metrics. Learning to read these stories helps you understand what content works and why.
Traffic source analysis
TikTok shows where your views come from: For You page, Following feed, Hashtag pages, Profile views, and other sources. This breakdown reveals how discoverable your content is.
For You page traffic indicates TikTok's algorithm is promoting your content to new audiences. This is where viral growth happens. Videos with 70%+ For You page traffic often perform exceptionally well.
High Profile or Following traffic suggests your existing audience loves the content, but it might not be reaching new viewers. This could indicate algorithm suppression or content that's too niche.
Engagement timing patterns
Look at when engagement happens on your videos. Most interactions occur within the first few hours after posting, but some content has staying power and continues attracting engagement for days or weeks.
Early engagement velocity (likes and comments in the first hour) often predicts whether TikTok will push your content to larger audiences. Encourage immediate engagement with compelling hooks and calls-to-action.
Videos that gain traction slowly might indicate evergreen content that performs well in search results or gets shared outside TikTok. This type of content builds long-term value for your account.
Comment analysis
Read your comments, don't just count them. Comments reveal what resonates with viewers, what confuses them, and what they want to see more of. This is free market research.
Positive comments show you what aspects of your content work best. If people consistently compliment your editing style or humor, double down on those elements in future videos.
Questions in comments indicate content gaps you can fill with follow-up videos. TikTok's algorithm often boosts creators who respond to trending questions in their niche.
Using analytics to optimize your content strategy
Data without action is just interesting numbers. Here's how to turn your TikTok analytics into concrete improvements for your content strategy.
Content performance patterns
Look for patterns in your top-performing videos. Do they share similar formats, topics, lengths, or posting times? Identifying these patterns helps you create a repeatable formula for success.
Create a content audit spreadsheet tracking video topics, formats, performance metrics, and posting times. After 20-30 videos, clear patterns usually emerge.
Don't just copy your best-performing content exactly. Instead, identify the underlying elements that made it successful and apply those principles to new topics and formats.
Hashtag performance tracking
Track which hashtags appear on your best-performing videos. TikTok doesn't show hashtag-specific analytics, but you can manually correlate hashtag usage with video performance.
Mix trending hashtags with niche-specific tags and branded hashtags. The sweet spot is usually 3-5 hashtags total. More than that can look spammy and dilute your message.
Monitor hashtag performance over time. Tags that worked well last month might be oversaturated now. Keep testing new hashtag combinations based on current trends in your niche.
Posting optimization
Use your audience activity data to create a posting schedule, but don't become a slave to it. Test posting at different times and days to find what works specifically for your audience.
Consider your content production capacity. It's better to post high-quality content 3-4 times per week consistently than to post daily with inconsistent quality.
Batch content creation around your analytics insights. If educational content performs best for you, dedicate specific days to creating multiple educational videos at once.
Advanced analytics strategies
Once you understand basic metrics, these advanced strategies help you extract deeper insights from your TikTok analytics.
Cohort analysis for follower quality
Track how followers gained from specific videos engage with your future content. Followers from viral comedy videos might not engage with educational content, and vice versa.
This follower quality analysis helps you understand which content attracts your ideal audience versus content that just generates vanity metrics.
Focus on creating more content similar to videos that brought high-quality, engaged followers rather than just chasing viral moments that don't align with your brand.
Competitive benchmarking
While you can't see other creators' detailed analytics, you can observe their posting patterns, engagement rates, and content strategies. Use this for competitive intelligence.
Track 5-10 creators in your niche. Note their posting frequency, content formats, engagement rates, and any patterns in their viral content.
Look for content gaps in your niche. If competitors aren't covering specific topics or using certain formats, that's an opportunity for you to fill the void.
Cross-platform analytics correlation
If you're active on multiple social platforms, correlate your TikTok performance with your other channels. Content that performs well on TikTok might translate to other platforms with slight modifications.
Track traffic flow between platforms. Are TikTok viewers finding your Instagram or YouTube? Use TikTok's bio link and video captions strategically to drive cross-platform growth.
Consider repurposing high-performing TikTok content for other platforms. A viral TikTok can become a YouTube Short, Instagram Reel, and Twitter video with minimal additional work.
Try Schedulala for free
Schedule posts to Bluesky, Twitter, and 8 other platforms from one dashboard.
Get started for free→Common analytics mistakes to avoid
Even experienced creators make these analytics mistakes that can mislead their strategy decisions.
Vanity metric obsession
Follower count and total views feel good but don't directly translate to success. A creator with 10K engaged followers often outperforms someone with 100K passive followers.
Focus on engagement rates, watch time, and follower growth velocity instead. These metrics better predict long-term success and monetization potential.
Resist the urge to chase viral moments that don't align with your content strategy. One-off viral videos rarely lead to sustainable growth if they don't match your usual content.
Short-term thinking
Daily analytics checking can drive you crazy and lead to poor decisions. TikTok's algorithm is complex and video performance can fluctuate significantly day to day.
Review analytics weekly or bi-weekly for strategic decisions. Daily checks should only be for monitoring comments and engagement on recent posts.
Some content performs better over time as it gets discovered through hashtags or search. Don't write off videos that don't immediately go viral.
Ignoring negative signals
Low completion rates and declining engagement are signals to adjust your strategy, not reasons to post more frequently. Quality trumps quantity on TikTok.
If multiple recent videos underperform, take a break to analyze what changed rather than continuing to post similar content hoping for different results.
Pay attention to comment sentiment shifts. If your audience seems less engaged or more negative, it might indicate content fatigue or a need to refresh your approach.
Tools and resources for deeper analytics
TikTok's built-in analytics are comprehensive, but third-party tools can provide additional insights and streamline your analysis process.
Third-party analytics platforms
Social media management platforms like Schedulala often provide enhanced analytics dashboards that combine TikTok data with other social platforms for comprehensive reporting.
These tools typically offer better data visualization, automated reporting, and the ability to track competitors alongside your own performance.
Look for platforms that provide hashtag analytics, optimal posting time recommendations, and content performance predictions based on historical data.
Manual tracking systems
Create a content performance spreadsheet tracking video topics, formats, hashtags, posting times, and key metrics. This helps identify patterns TikTok's analytics might not make obvious.
Include qualitative notes about what was happening when you posted. Was it a trending topic day? Did you experiment with a new format? Context helps explain performance variations.
Track competitor performance manually since TikTok doesn't provide competitive analytics. Note their posting patterns, engagement rates, and content strategies.
Turning insights into growth
Analytics are only valuable if they drive better content decisions. Here's how to turn your TikTok insights into sustained growth.
Weekly analytics reviews should result in specific action items. Maybe you discovered your audience prefers shorter videos, or that educational content outperforms entertainment. Turn these insights into content calendar changes.
Test one variable at a time. If you want to improve watch time, experiment with different hook styles before changing your entire content format. Isolated testing helps you understand what actually moves the needle.
Document your experiments. What seemed like a failed test might reveal important insights when viewed alongside future data. Keep notes on what you tried and why.
Remember that consistency beats perfection. Better to post good content regularly using your analytics insights than to wait for perfect content that never gets published.