Instagram Insights Explained: Complete Guide to Analytics That Actually Drive Growth
Master Instagram Insights with our complete guide. Learn to read analytics, track engagement metrics, and optimize your content strategy for real growth.
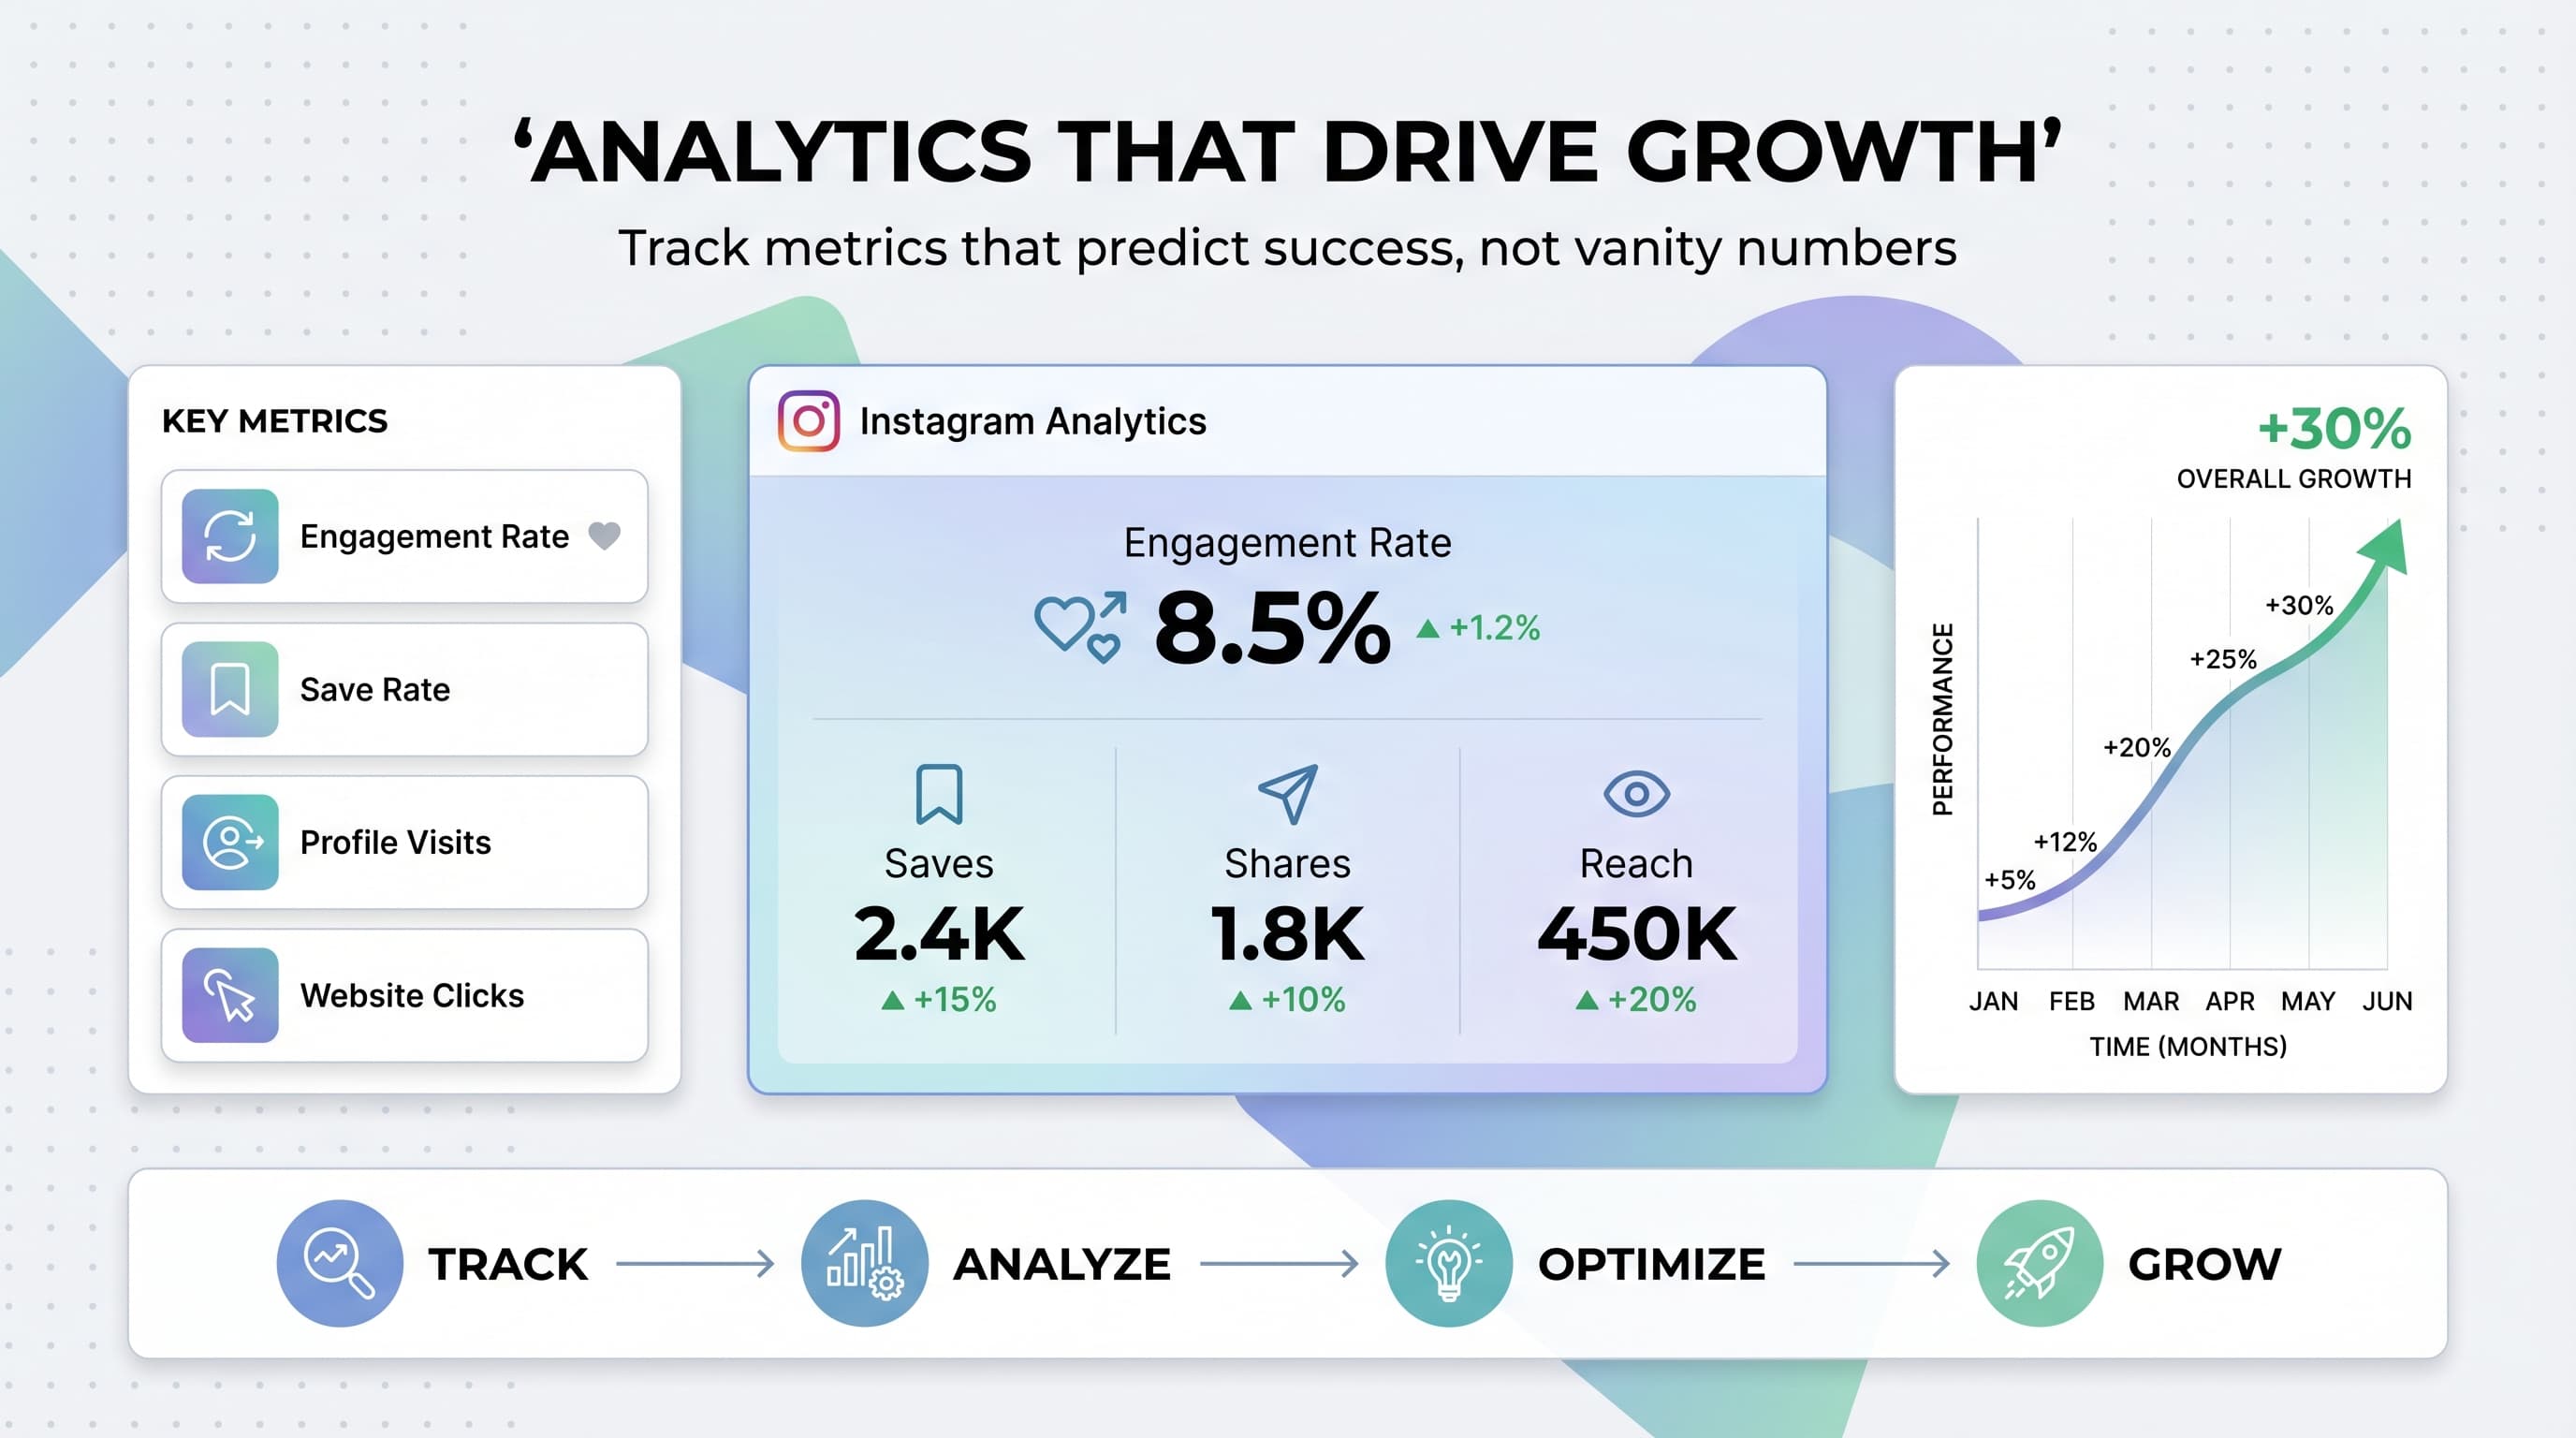
Your Instagram posts are getting likes, but are you actually reaching your target audience? Our Instagram scheduling can help.
See It in Action
This is what scheduling an Instagram post looks like in Schedulala
Instagram Insights holds the answers to every question about your content performance. This free analytics tool shows you exactly who engages with your posts, when your followers are most active, and which content types drive the most meaningful results. The problem is, most creators and businesses look at these numbers without understanding what they mean or how to use them strategically. Learn more about scheduling across platforms.
Try Schedulala for free
Schedule posts to Bluesky, Twitter, and 8 other platforms from one dashboard.
Get started for free→What are Instagram Insights and why they matter
Instagram Insights is the platform's native analytics tool, available to all business and creator accounts. It tracks everything from basic engagement metrics to detailed audience demographics and content performance data. See our how to repurpose content guide.
The tool became essential when Instagram shifted from a chronological feed to an algorithm-based system. Now, understanding your analytics isn't just helpful, it's required if you want your content to reach anyone beyond your existing followers. Our content calendar can help.
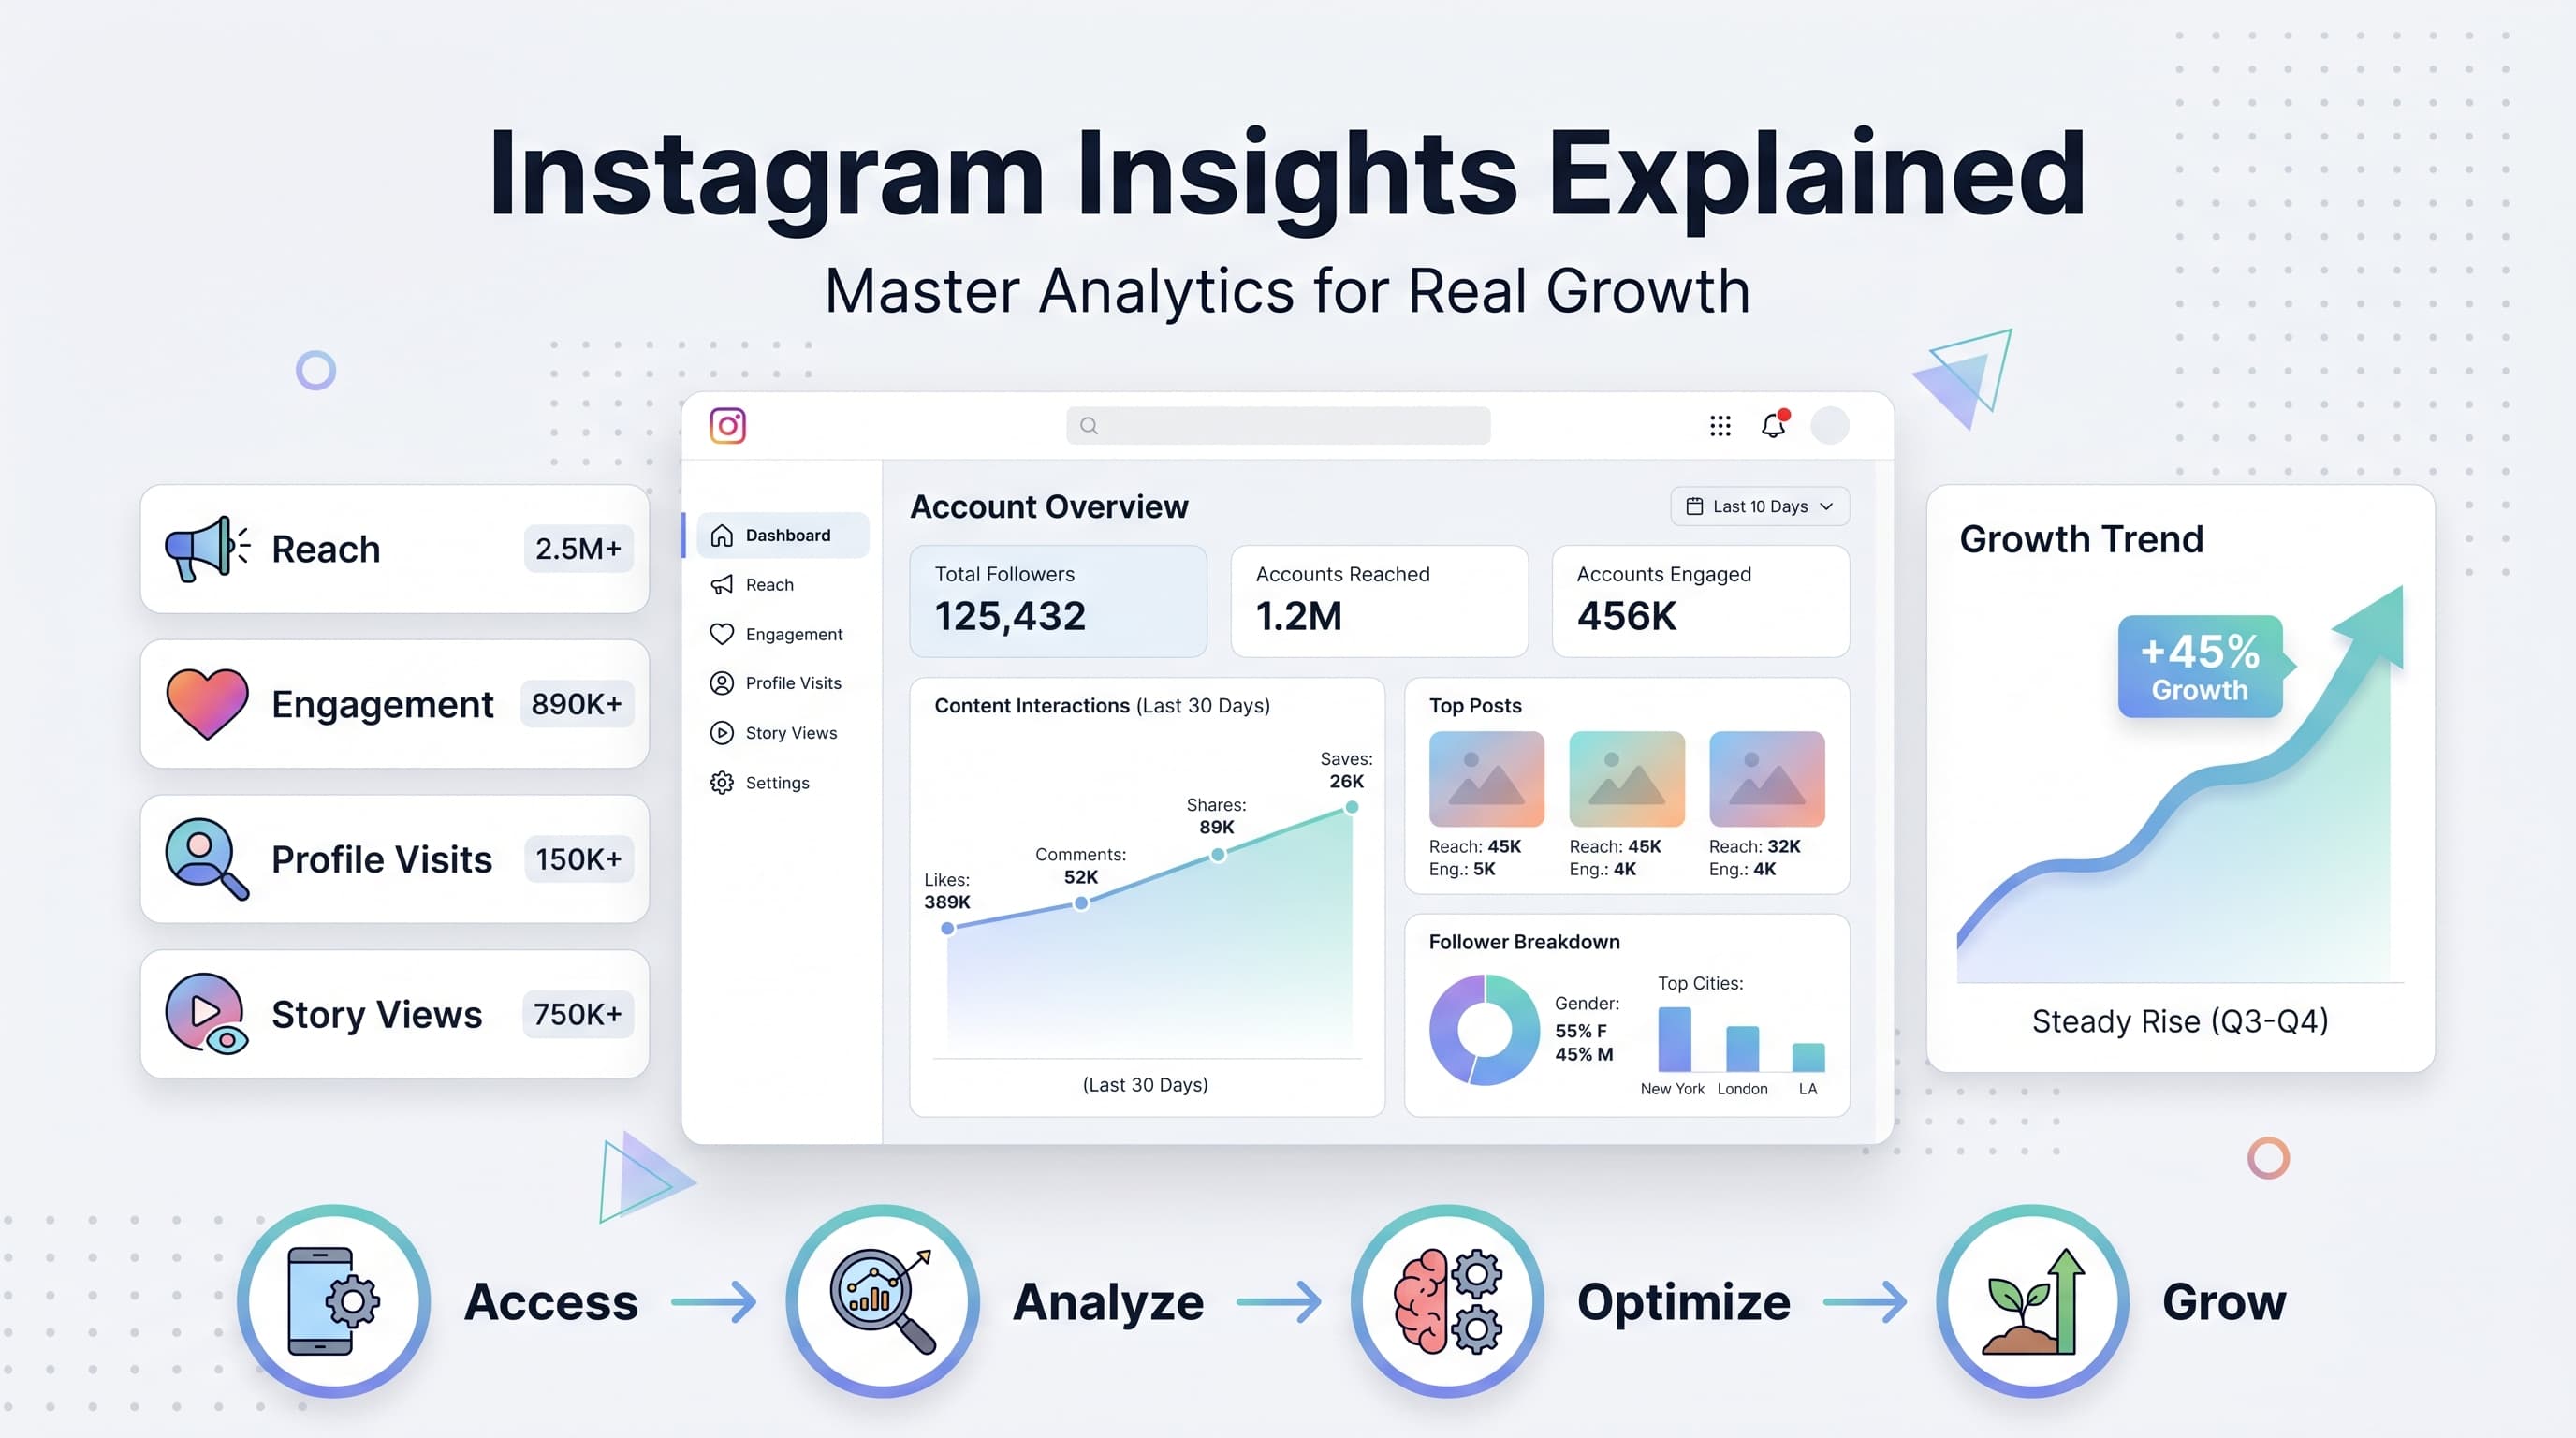
1. Account insights overview
The overview section shows your account's performance over the past week, including reach, profile visits, and follower growth. This snapshot helps you understand whether your overall strategy is working. Try our best time to post on instagram.
Look for patterns in your weekly performance. If you notice consistent drops in reach or engagement, it's time to evaluate your content strategy or posting schedule. Our instagram engagement calculator can help.
2. Content performance breakdown
Individual post insights reveal which content types resonate most with your audience. You can see detailed metrics for posts, stories, reels, and IGTV videos.
Pay special attention to the reach versus impressions ratio. High impressions with low reach means people are seeing your content multiple times, which could indicate strong engagement or algorithmic preference.
3. Audience data and demographics
Audience insights show who actually follows and engages with your content. This includes age ranges, gender distribution, geographic location, and most active hours.
This data is gold for content creators and businesses. If your audience is primarily 25-34 year olds in urban areas, your content strategy should reflect their interests and posting times should align with their schedules.
How to access Instagram Insights
First, you need either a business or creator account. Personal accounts don't have access to Instagram Insights. If you're currently using a personal account, switching takes less than two minutes and doesn't affect your existing content or followers.
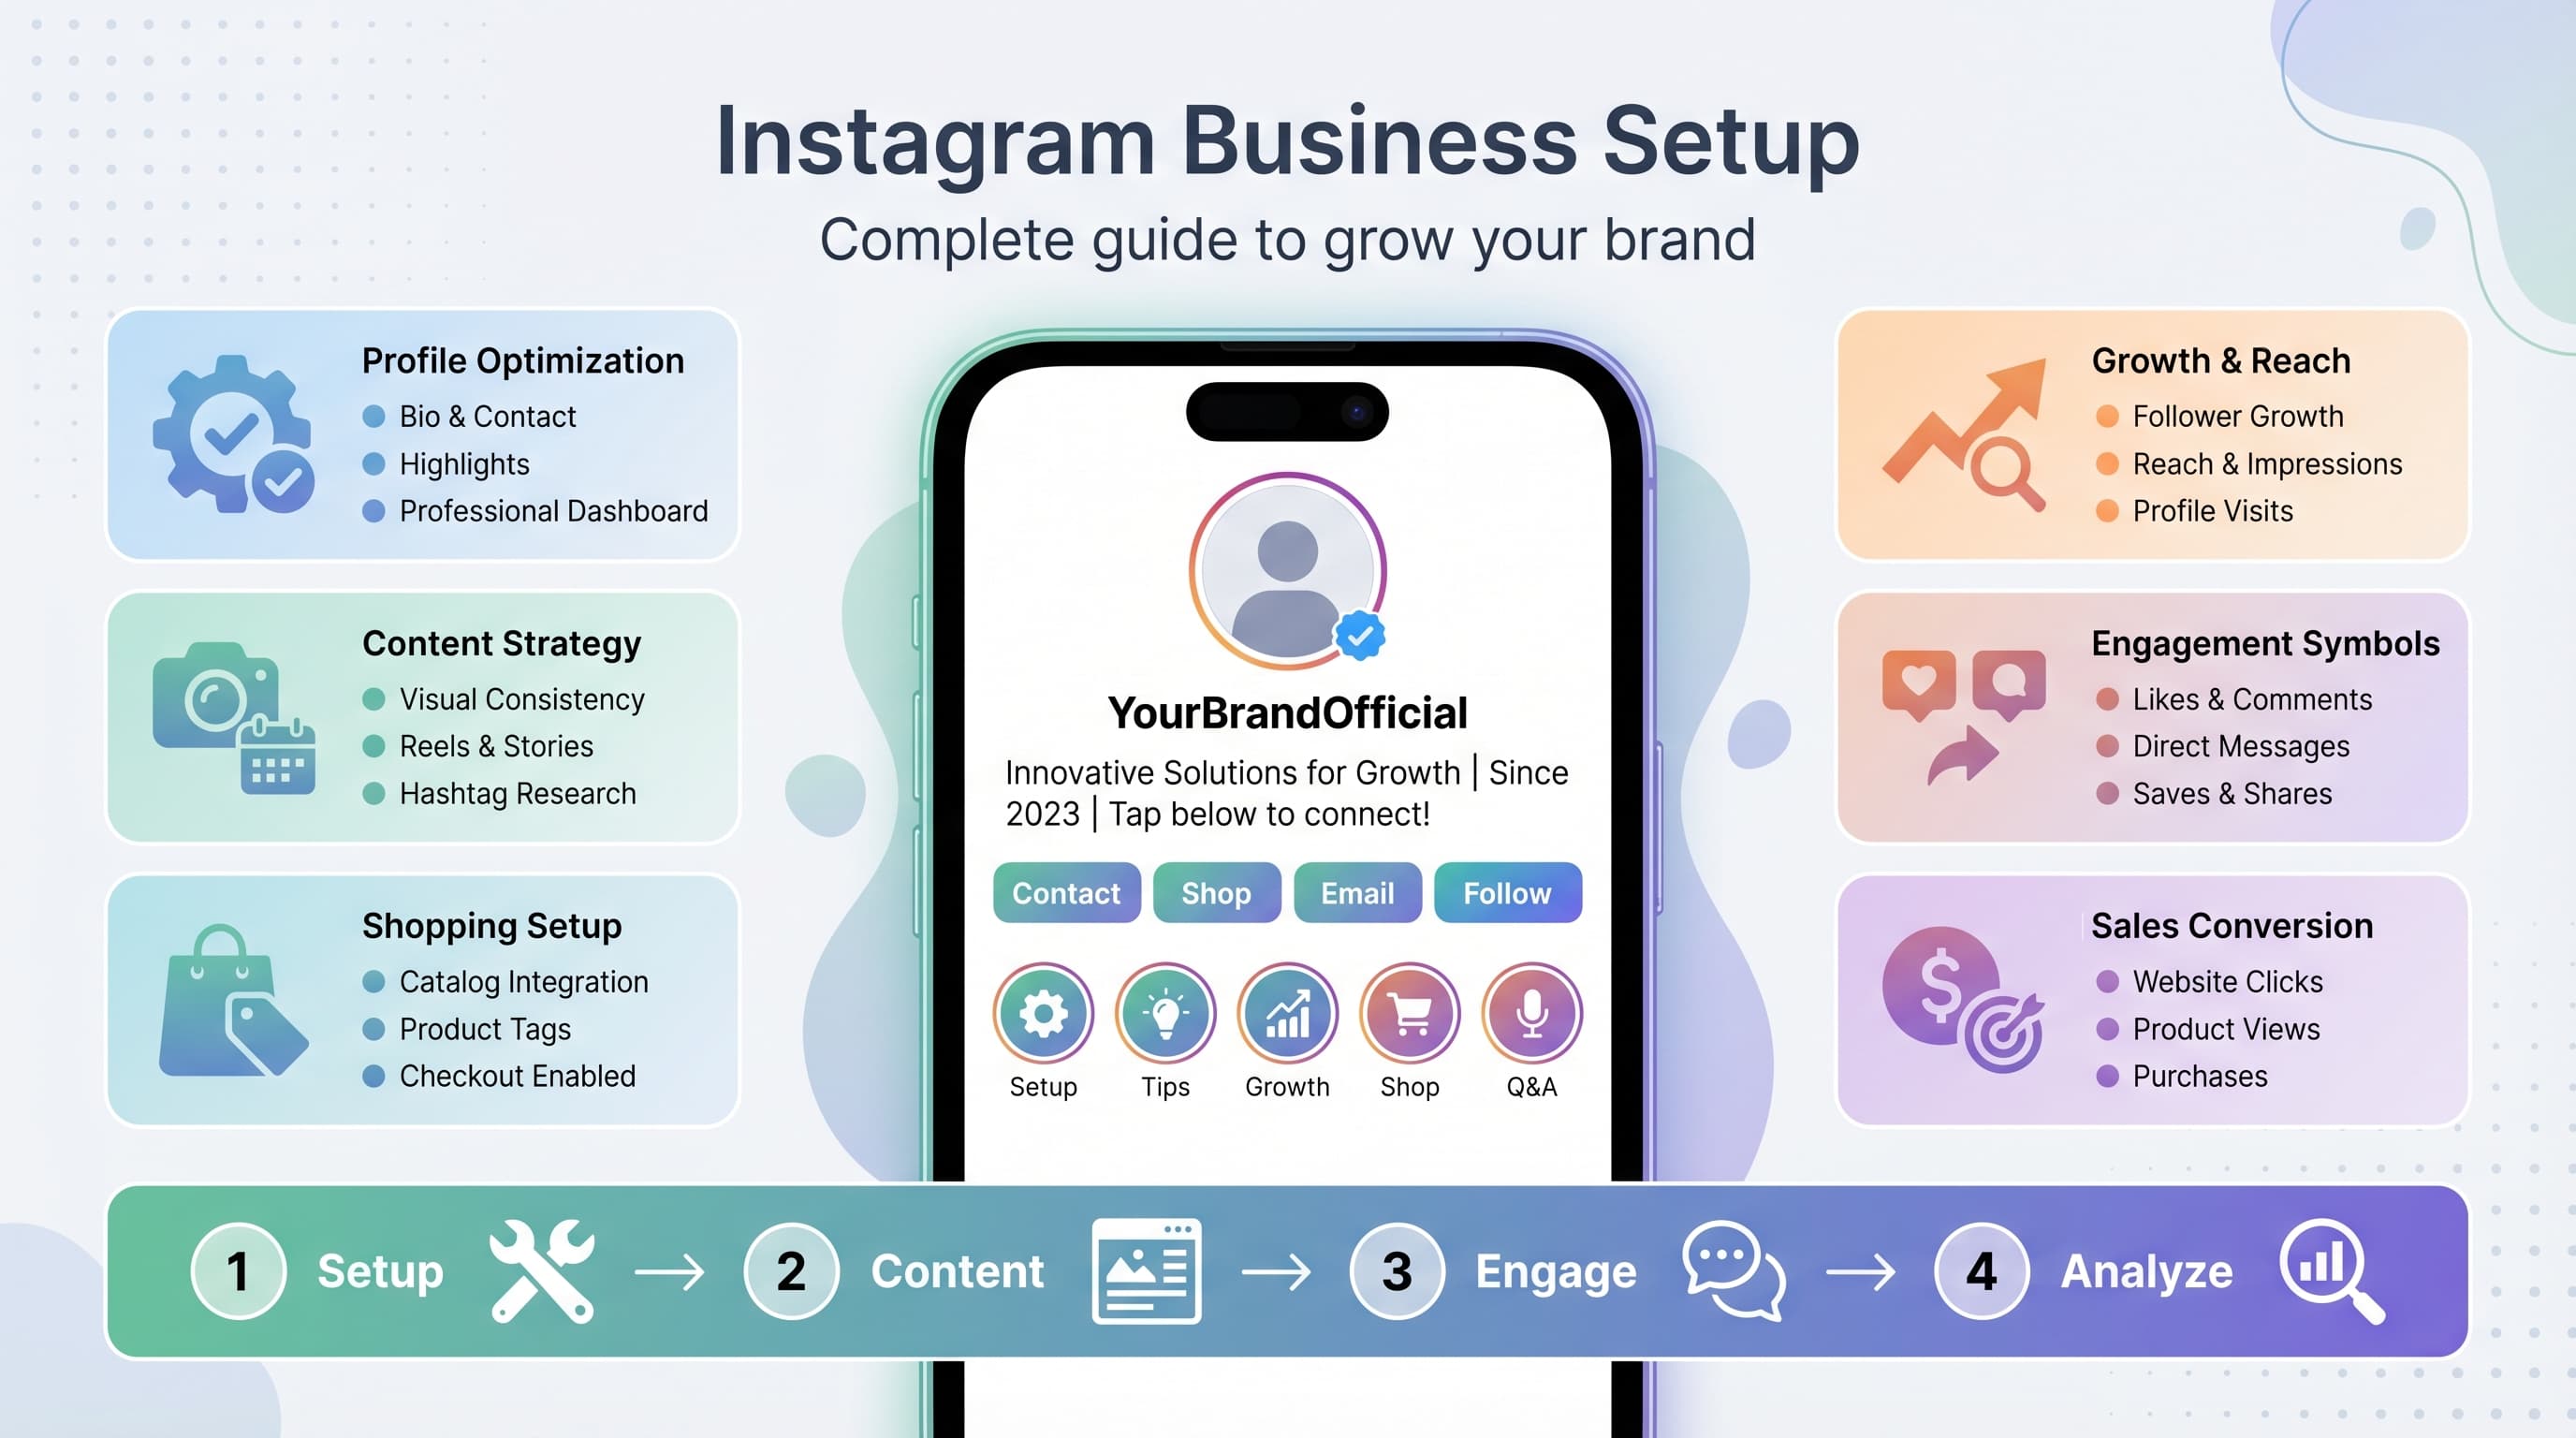
1. Switch to a business or creator account
Go to your profile and tap the three lines in the top right corner. Select Settings, then Account, then Switch to Professional Account.
Choose between Creator (better for influencers, artists, public figures) or Business (better for companies, brands, services). Both have access to the same Insights features.
- Creator accounts get music options for stories
- Business accounts can add contact buttons
- Both see identical analytics data
- You can switch between them anytime
2. Navigate to your analytics
Once your account is converted, you'll see Insights as an option in your profile menu. Tap the three lines, select Insights, and you'll land on the overview page.
You can also access individual post insights by tapping View Insights below any post on your profile. This gives you detailed metrics for that specific piece of content.
Understanding key Instagram metrics
Instagram tracks dozens of different metrics, but only a handful actually matter for most creators and businesses. Here's what each number means and why you should care about it.
1. Reach vs impressions
Reach is the number of unique accounts that saw your content. Impressions is the total number of times your content was viewed, including multiple views from the same account.
If your impressions are much higher than your reach, it means people are viewing your content multiple times. This is generally positive and suggests engaging or valuable content.
A healthy reach-to-impression ratio is roughly 1:1.2 to 1:2. Much higher than 2:1 might indicate your content isn't reaching enough new people, while much lower suggests poor engagement.
2. Engagement rate calculation
Engagement rate is your total engagement (likes, comments, saves, shares) divided by your reach, multiplied by 100. Instagram doesn't calculate this automatically, but it's the most important metric for measuring content quality.
A good engagement rate varies by follower count, but generally 1-3% is average, 3-6% is good, and above 6% is excellent. Micro-influencers (1K-10K followers) typically see higher rates than larger accounts.
- Comments are weighted more heavily than likes
- Saves and shares signal high-value content
- Quick engagement (within first hour) boosts reach
- Consistent engagement matters more than viral spikes
3. Profile visits and follows
Profile visits show how many people clicked through to view your full profile after seeing your content. This metric indicates whether your posts are compelling enough to drive deeper interest.
The conversion rate from profile visits to follows is typically 10-20%. If yours is lower, your profile might need optimization. Check that your bio is clear, your highlights are organized, and your recent posts represent your best work.
4. Story completion rates
Story insights show how many people viewed each story slide and where they dropped off. This data reveals which content keeps attention and which causes people to skip forward.
Average story completion rates range from 70-90% for single slides. Multi-slide stories typically see 10-15% drop-off per slide. High-performing stories maintain 80%+ completion rates even with multiple slides.
Reading your audience insights effectively
Your audience data tells you who actually engages with your content, which often differs from who you think you're targeting. This information shapes everything from content topics to posting schedules.
1. Demographic breakdown analysis
Age and gender data show whether you're reaching your intended audience. If you're a fitness brand targeting young women but your audience is 60% male, your content strategy needs adjustment.
Geographic data reveals where your followers live, which affects optimal posting times and cultural references. An audience spread across multiple time zones requires different scheduling than a local audience.
Language preferences appear if you have international followers. This data helps decide whether to post in multiple languages or focus on your primary language.
2. Activity timing patterns
The activity graph shows when your followers are most active on Instagram, broken down by day and hour. This isn't necessarily when you should post, but it's a strong starting point for testing.
Peak activity times often cluster around commute hours (7-9 AM, 5-7 PM) and evening wind-down periods (8-10 PM). Weekend patterns typically differ from weekdays, with later morning starts and more afternoon activity.
Test posting 1-2 hours before peak activity times. This gives your content time to gain initial engagement, which can boost algorithmic distribution when more people come online.
3. Follower growth trends
Track follower growth over different time periods to identify patterns. Sudden spikes usually correlate with viral content or external mentions, while steady growth indicates consistent content quality.
Pay attention to unfollows as well as new followers. High unfollow rates after certain types of posts suggest content misalignment with audience expectations.
| Audience Metric | What It Tells You | Action to Take |
|---|---|---|
| Age Range | Whether you're reaching your target demographic | Adjust content style and topics |
| Top Locations | Geographic concentration of followers | Optimize posting times for major time zones |
| Gender Split | Audience composition | Tailor content themes and language |
| Peak Hours | When followers are most active | Schedule posts 1-2 hours before peaks |
| Growth Rate | Account momentum | Identify successful content patterns |
Analyzing individual post performance
Each post's individual insights reveal what resonates with your audience. This granular data is where you'll find the patterns that inform your content strategy.
1. Content type performance comparison
Compare how different content types perform: single photos, carousel posts, videos, and reels. Most accounts see reels getting the highest reach, but other formats might drive better engagement rates.
Carousel posts often generate high engagement because people swipe through multiple images, creating multiple interactions with one post. Single photos need to be particularly compelling to compete.
Video content typically holds attention longer but requires more production time. Track your video completion rates to see if the extra effort translates to better results.
2. Caption and hashtag effectiveness
While Instagram doesn't show direct hashtag performance, you can infer effectiveness by comparing reach sources. Posts with higher percentages of reach from hashtags indicate effective tag selection.
Caption length and style affect engagement patterns. Questions, calls-to-action, and personal stories typically generate more comments than purely promotional content.
Save rates often correlate with valuable captions. Educational content, tips, and resources get saved more frequently than entertainment-focused posts.
3. Timing and frequency insights
Track how posting time affects individual post performance. Your audience activity data provides a baseline, but actual performance reveals optimal times for your specific content.
Posts published when you have recent engagement (comments, DMs, story views) often perform better because Instagram's algorithm considers recent activity when distributing new content.
Story insights and what they reveal
Instagram Stories generate different metrics than feed posts, and understanding these numbers helps you create more engaging story content that keeps viewers watching.
1. Story reach vs profile reach
Story reach often exceeds feed post reach because stories appear prominently at the top of the Instagram app. This makes stories valuable for maintaining visibility between feed posts.
Stories also reach different audiences than feed posts. Some followers engage heavily with stories but rarely like or comment on feed posts, while others scroll past stories entirely.
Track which followers view your stories consistently. These are often your most engaged followers and potential customers or collaborators.
2. Story completion and drop-off rates
Instagram shows exactly where people stop watching your story sequence. High drop-off points reveal content that doesn't hold attention or doesn't flow well with surrounding slides.
Text-heavy slides typically see more drop-offs than visual content. Break long text into multiple slides or use engaging visuals to maintain attention.
Stories with interactive elements (polls, questions, quizzes) generally retain viewers longer and generate better overall engagement.
3. Navigation actions breakdown
Instagram tracks how people navigate your stories: forward taps, back taps, and exits. High exit rates on specific slides indicate content issues.
Back taps suggest viewers want to see something again, which is positive engagement. Forward taps might indicate boredom or eagerness to see what's next.
Profile visits from stories often convert better than profile visits from feed posts, since story viewers are typically more engaged followers.
Using insights to optimize your content strategy
Data without action is just numbers. Here's how to turn your Instagram Insights into concrete improvements for your content strategy and overall account growth.
1. Content calendar optimization
Use your audience activity data to plan posting times, but don't rely solely on the suggested peak hours. Test different times within those peak periods to find your optimal slots.
Plan content types based on performance data. If reels consistently outperform photos in reach but photos generate better engagement rates, create a balanced mix that serves both goals.
Identify your best-performing content themes and create more variations. If educational posts get high saves but lifestyle content generates more comments, alternate between both to maximize different engagement types.
2. Hashtag strategy refinement
Track which posts get the highest percentage of reach from hashtags versus home feed or profile visits. High hashtag reach indicates you're using tags that connect with new audiences.
Avoid hashtag sets that consistently underperform. If posts using certain tag combinations show low reach or engagement, those hashtags might be oversaturated or irrelevant to your audience.
Test hashtag volume systematically. Some accounts perform better with 5-10 strategic tags, while others benefit from the full 30-tag limit. Your insights will reveal what works for your specific account.
3. Audience growth tactics
Focus on content types that drive the highest profile visit rates. These posts effectively introduce new people to your account and have the highest potential for follower conversion.
Create content specifically for your most active followers during peak engagement times. These people are most likely to interact quickly with new posts, boosting algorithmic distribution.
Use story highlights strategically based on story performance data. Turn your best-performing stories into permanent highlights that new profile visitors will see.
Common Instagram Insights mistakes to avoid
Understanding your analytics is just as much about knowing what not to focus on as it is about identifying key metrics. Here are the most common mistakes that lead creators and businesses astray.
1. Obsessing over vanity metrics
Follower count and total likes feel important, but they don't directly correlate with business results or meaningful engagement. An account with 10,000 followers and 2% engagement rate performs worse than one with 1,000 followers and 8% engagement.
Focus on engagement rate, profile visits, and conversion metrics instead. These numbers indicate whether your audience actually cares about your content and brand.
Story views can be misleading too. High story view counts don't matter if people are immediately tapping forward without reading or engaging with your content.
2. Making decisions based on single posts
One viral post or one poorly performing post doesn't indicate a trend. Instagram's algorithm can be unpredictable, and external factors affect individual post performance.
Look for patterns across at least 10-15 posts before making strategic changes. Consistent underperformance indicates a real issue, while isolated poor performance might just be timing or algorithm quirks.
Similarly, don't completely overhaul your strategy based on one successful post. Replicate elements of high-performing content rather than trying to recreate viral moments exactly.
3. Ignoring time zone considerations
Instagram's activity data reflects when your followers are online, but it doesn't account for their actual time zones if they're spread globally.
Check your audience's top locations and calculate peak times for those regions. If 40% of your followers are in New York and 30% are in Los Angeles, optimize for Eastern time but don't ignore the West Coast entirely.
Weekend posting patterns often differ significantly from weekday patterns. Many creators assume weekend performance is always lower, but some audiences are more active on Saturday and Sunday.
4. Misunderstanding reach fluctuations
Reach naturally fluctuates based on Instagram's algorithm, your posting frequency, and your audience's online behavior. Temporary reach drops don't automatically mean you're being shadow banned or penalized.
Instagram tends to show your content to a small portion of your followers first, then expands reach based on initial engagement. This means reach can continue growing hours or days after posting.
Seasonal patterns affect reach too. Holiday periods, major events, and even weather changes can impact how much time people spend on Instagram and how they engage with content.
Advanced insights strategies for growth
Once you master the basics of Instagram Insights, these advanced techniques help you extract deeper strategic value from your analytics data.
1. Cross-platform performance correlation
If you post similar content across multiple platforms, compare performance patterns between Instagram and other channels. Content that performs well on Instagram but poorly elsewhere might indicate platform-specific preferences.
Track how Instagram traffic converts on your website or other platforms. High Instagram engagement doesn't always translate to external conversions, which might indicate audience quality or content alignment issues.
Use Instagram's website click data alongside Google Analytics to understand the full customer journey from Instagram discovery to final conversion.
2. Competitor benchmarking strategies
While you can't see competitors' exact insights, you can observe their posting patterns and engagement rates to benchmark your performance. Similar accounts in your niche should have comparable engagement rates.
Notice which competitor content gets high engagement and test similar approaches with your unique perspective. Don't copy directly, but adapt successful formats and topics to your brand voice.
Track competitor growth patterns over time. Sudden spikes often indicate successful campaigns or viral content that you can learn from.
3. Seasonal and trend analysis
Compare your current performance to the same periods in previous months or years. Seasonal businesses especially need to understand these patterns for accurate forecasting and strategy planning.
Track how quickly you adapt to new Instagram features and trends. Accounts that test new features early often see temporary reach boosts as Instagram promotes new functionality.
Monitor your insights during major cultural events, holidays, or news cycles. Understanding how external factors affect your performance helps with content planning and expectation setting.
Try Schedulala for free
Schedule posts to Bluesky, Twitter, and 8 other platforms from one dashboard.
Get started for free→Tools to enhance your Instagram analytics
While Instagram's native insights provide comprehensive data, third-party tools can help you track long-term trends, automate reporting, and gain additional perspectives on your performance.
1. Social media management platforms
Platforms like Schedulala offer enhanced analytics that complement Instagram's native insights. These tools often provide longer historical data retention, custom reporting, and cross-platform comparison features.
Third-party analytics can track metrics Instagram doesn't show, like optimal hashtag performance, best posting times based on actual engagement rather than follower activity, and competitor analysis.
Many management platforms also offer automated reporting, which helps you track long-term trends without manually checking insights daily.
2. Content planning integration
Use your insights data to inform content calendar planning. Tools that integrate analytics with scheduling help you plan future content based on past performance patterns.
Track content themes and formats over time to identify what works best during different seasons, events, or periods in your business cycle.