Instagram Analytics: Metrics That Matter for Real Growth in 2026
Master Instagram analytics with our complete guide. Learn which metrics drive real growth, how to track them, and actionable strategies to boost engagement.
Quick answer
Track Instagram analytics through Instagram Insights on business accounts, focusing on reach, saves, shares, and profile visits.
- •Instagram Insights is free for all business and creator accounts
- •Saves and shares are the strongest engagement signals for the algorithm
- •Track profile visits and link clicks to measure business impact directly
- •Schedulala's Team plan ($18/month) includes cross-platform analytics for Instagram and 9 other platforms
Your Instagram posts get decent likes, but your business isn't growing. Sound familiar? See our Instagram scheduling guide.
See It in Action
This is what scheduling an Instagram post looks like in Schedulala
The problem isn't your content. It's that you're tracking vanity metrics while ignoring the data that actually predicts success. Instagram analytics can feel overwhelming, with dozens of numbers scattered across multiple screens. But most creators and businesses focus on the wrong metrics entirely. Learn more about the best story scheduler:.
This guide breaks down exactly which Instagram metrics matter for growth, how to find them, and what to do with the data. You'll learn to spot the early warning signs of declining performance and make data-driven decisions that actually move the needle. Try our the best time to.
Try Schedulala for free
Schedule posts to Bluesky, Twitter, and 8 other platforms from one dashboard.
Get started for free→Why most Instagram analytics are misleading
Instagram's native analytics tell a story, but it's often the wrong one. The app pushes follower count and likes to the top because they're easy to understand. But these surface-level metrics don't correlate with business results. Try our scheduling across platforms.
Take follower count. An account with 10,000 engaged followers will consistently outperform one with 100,000 passive followers. Yet most people obsess over hitting follower milestones while their engagement rate plummets. Try our best time to post on instagram.
The same logic applies to likes. A post with 500 likes might seem less successful than one with 2,000 likes. But if the first post drove 50 website clicks and 10 sales while the second drove zero business results, which really performed better? Learn more about instagram engagement calculator.
Instagram's algorithm doesn't care about vanity metrics either. It prioritizes content that generates meaningful interactions: comments, shares, saves, and profile visits. These engagement signals tell the algorithm your content is worth showing to more people.
Smart creators focus on leading indicators rather than lagging ones. Leading indicators predict future growth and catch problems early. Lagging indicators just tell you what already happened, often when it's too late to course-correct.
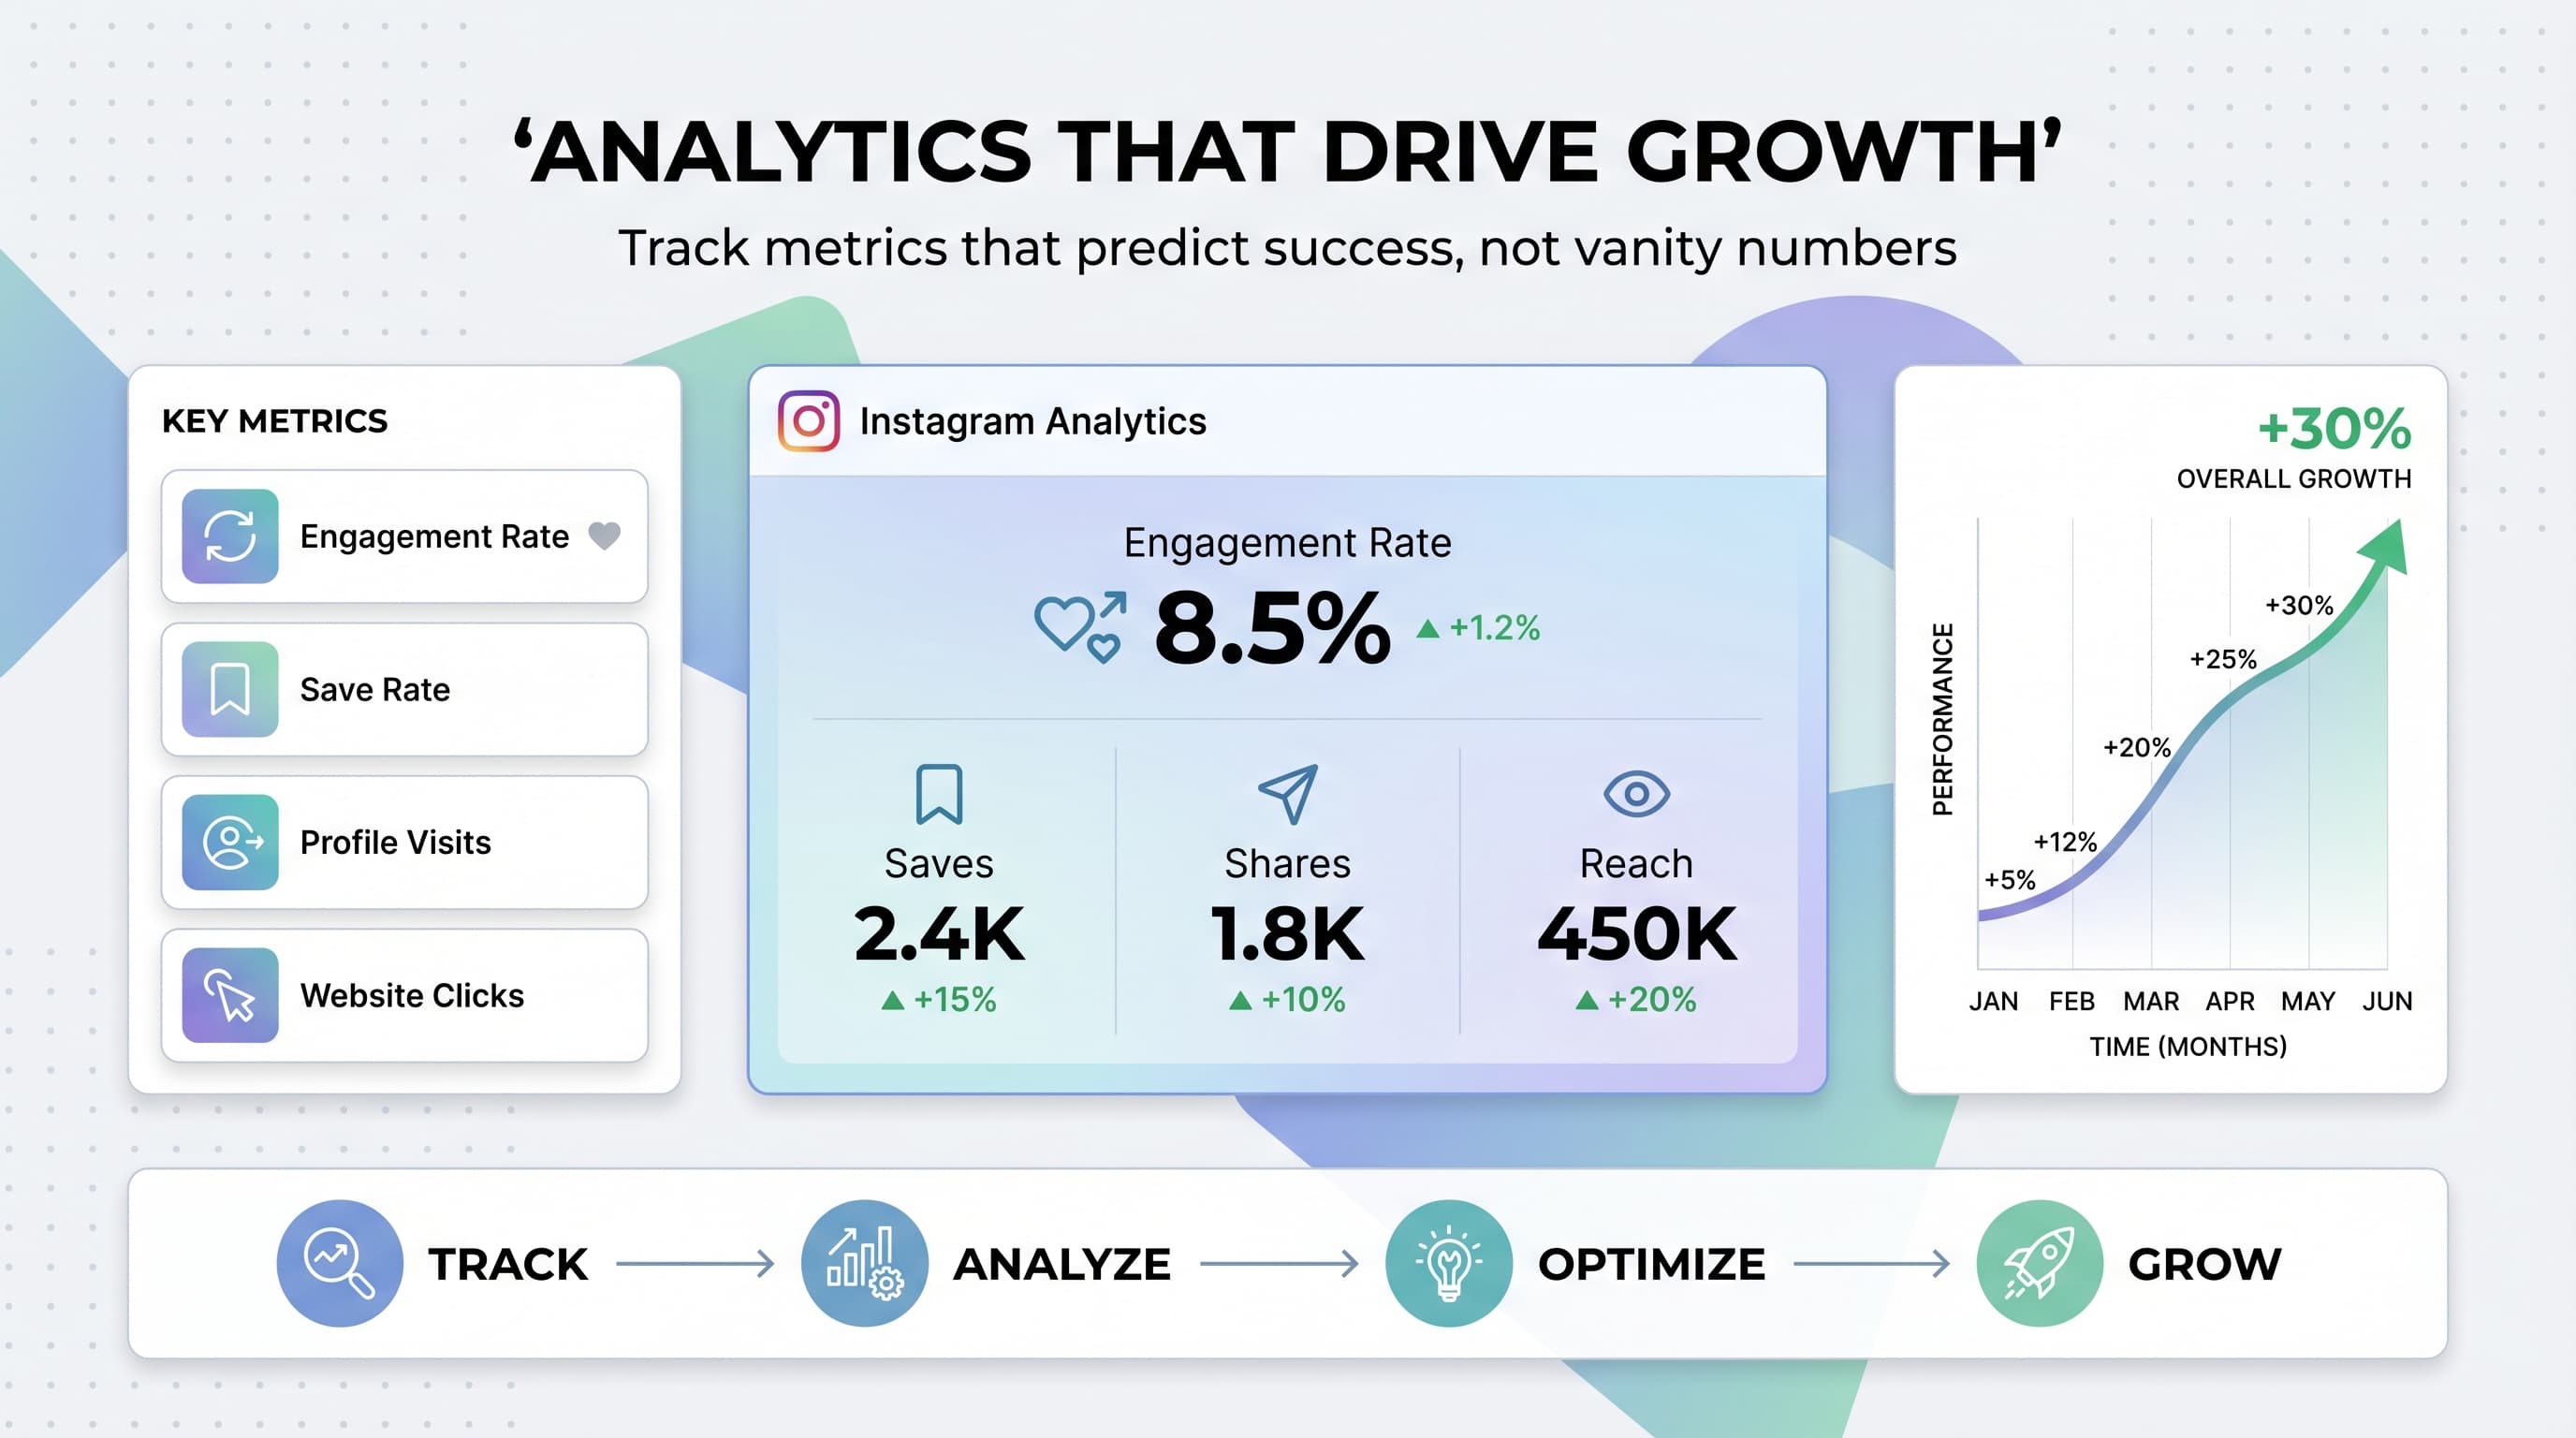
The 8 Instagram metrics that actually predict growth
These metrics consistently correlate with account growth and business results across industries. Focus your energy here instead of chasing follower counts.
1. Engagement rate by reach
This metric shows how engaging your content is to people who actually see it. Calculate it by dividing total engagements (likes + comments + shares + saves) by reach, then multiply by 100.
Why it matters: High engagement rate by reach signals to Instagram that your content resonates. The algorithm will show it to more people. Aim for 3-6% for most account sizes. If you're consistently below 2%, your content needs work.
Where to find it: Instagram Insights > Posts > Individual post performance. You'll need to calculate this manually since Instagram doesn't provide it automatically.
2. Save rate
Saves are Instagram's strongest engagement signal. When someone saves your post, they're telling the algorithm it's valuable enough to reference later. Instagram interprets saves as a vote of confidence in your content quality.
Calculate save rate by dividing saves by reach, then multiply by 100. A good save rate is 0.5-2% for most content types. Educational and inspirational posts typically get higher save rates than entertainment content.
Where to find it: Individual post insights show save counts. Some third-party analytics tools calculate save rate automatically, but you can track it manually in a spreadsheet.
3. Share rate
Shares amplify your reach organically and signal high-quality content to Instagram. When someone shares your post to their story or sends it via DM, they're essentially endorsing your content to their audience.
Calculate share rate the same way as save rate. Target 0.3-1.5% for most content types. Relatable, funny, or controversial content typically gets shared more than educational posts.
Where to find it: Post insights show share counts, but they don't break down story shares versus DM shares. Story shares are generally more valuable for reach.
4. Comments per reach
Comments require more effort than likes, making them a stronger engagement signal. But raw comment count can be misleading if you have a small reach. Comments per reach normalizes this metric across different post performances.
Aim for 0.5-2 comments per 100 people reached. Posts that spark conversation and debate typically perform better than those that just get likes. Ask questions, share controversial opinions, or create content that begs for a response.
Quality matters too. A 20-word thoughtful comment is worth more than 10 one-word reactions. Engage meaningfully with commenters to encourage longer conversations.
5. Profile visits from posts
Profile visits indicate someone is interested enough in your content to learn more about you. This metric bridges the gap between content performance and follower growth. High-performing posts should drive 1-5% of viewers to visit your profile.
Track which content types drive the most profile visits. Usually, it's content that showcases your personality, expertise, or behind-the-scenes moments. Generic quote posts rarely drive profile traffic.
Where to find it: Instagram Insights > Content > Individual posts > Profile visits. This metric is only available for business and creator accounts.
6. Website clicks
If you're using Instagram for business, website traffic is often more valuable than followers. Track clicks on your bio link, story links, and any other traffic drivers. This metric directly correlates with business results.
Don't just count clicks. Track what happens after the click. Use UTM parameters to see which Instagram content drives the most valuable traffic. Set up goals in Google Analytics to measure conversions from Instagram traffic.
Where to find it: Instagram Insights shows basic link click data. Use tools like Bitly or your website analytics for more detailed tracking.
7. Story completion rate
This metric shows how many people watch your entire story sequence versus those who tap away early. High completion rates indicate engaging story content. Low rates suggest you're losing your audience's attention.
Aim for 70%+ completion rates on story sequences under 5 slides. Longer sequences naturally have lower completion rates. Track which story types keep people watching and which ones make them click away.
Where to find it: Story insights show exit points for each slide. Calculate completion rate by dividing final slide views by first slide views.
8. Follower growth rate
While raw follower count doesn't matter much, growth rate does. Consistent growth indicates your content strategy is working. Declining growth rates often predict other problems before they show up in engagement metrics.
Calculate monthly growth rate by dividing net new followers by total followers at the start of the month. Healthy accounts grow 2-10% monthly depending on size and niche. Faster growth often comes from viral content or paid promotion.
Pay attention to follower quality too. Rapid growth from irrelevant followers will hurt your engagement rate and algorithm performance long-term.
How to access Instagram analytics
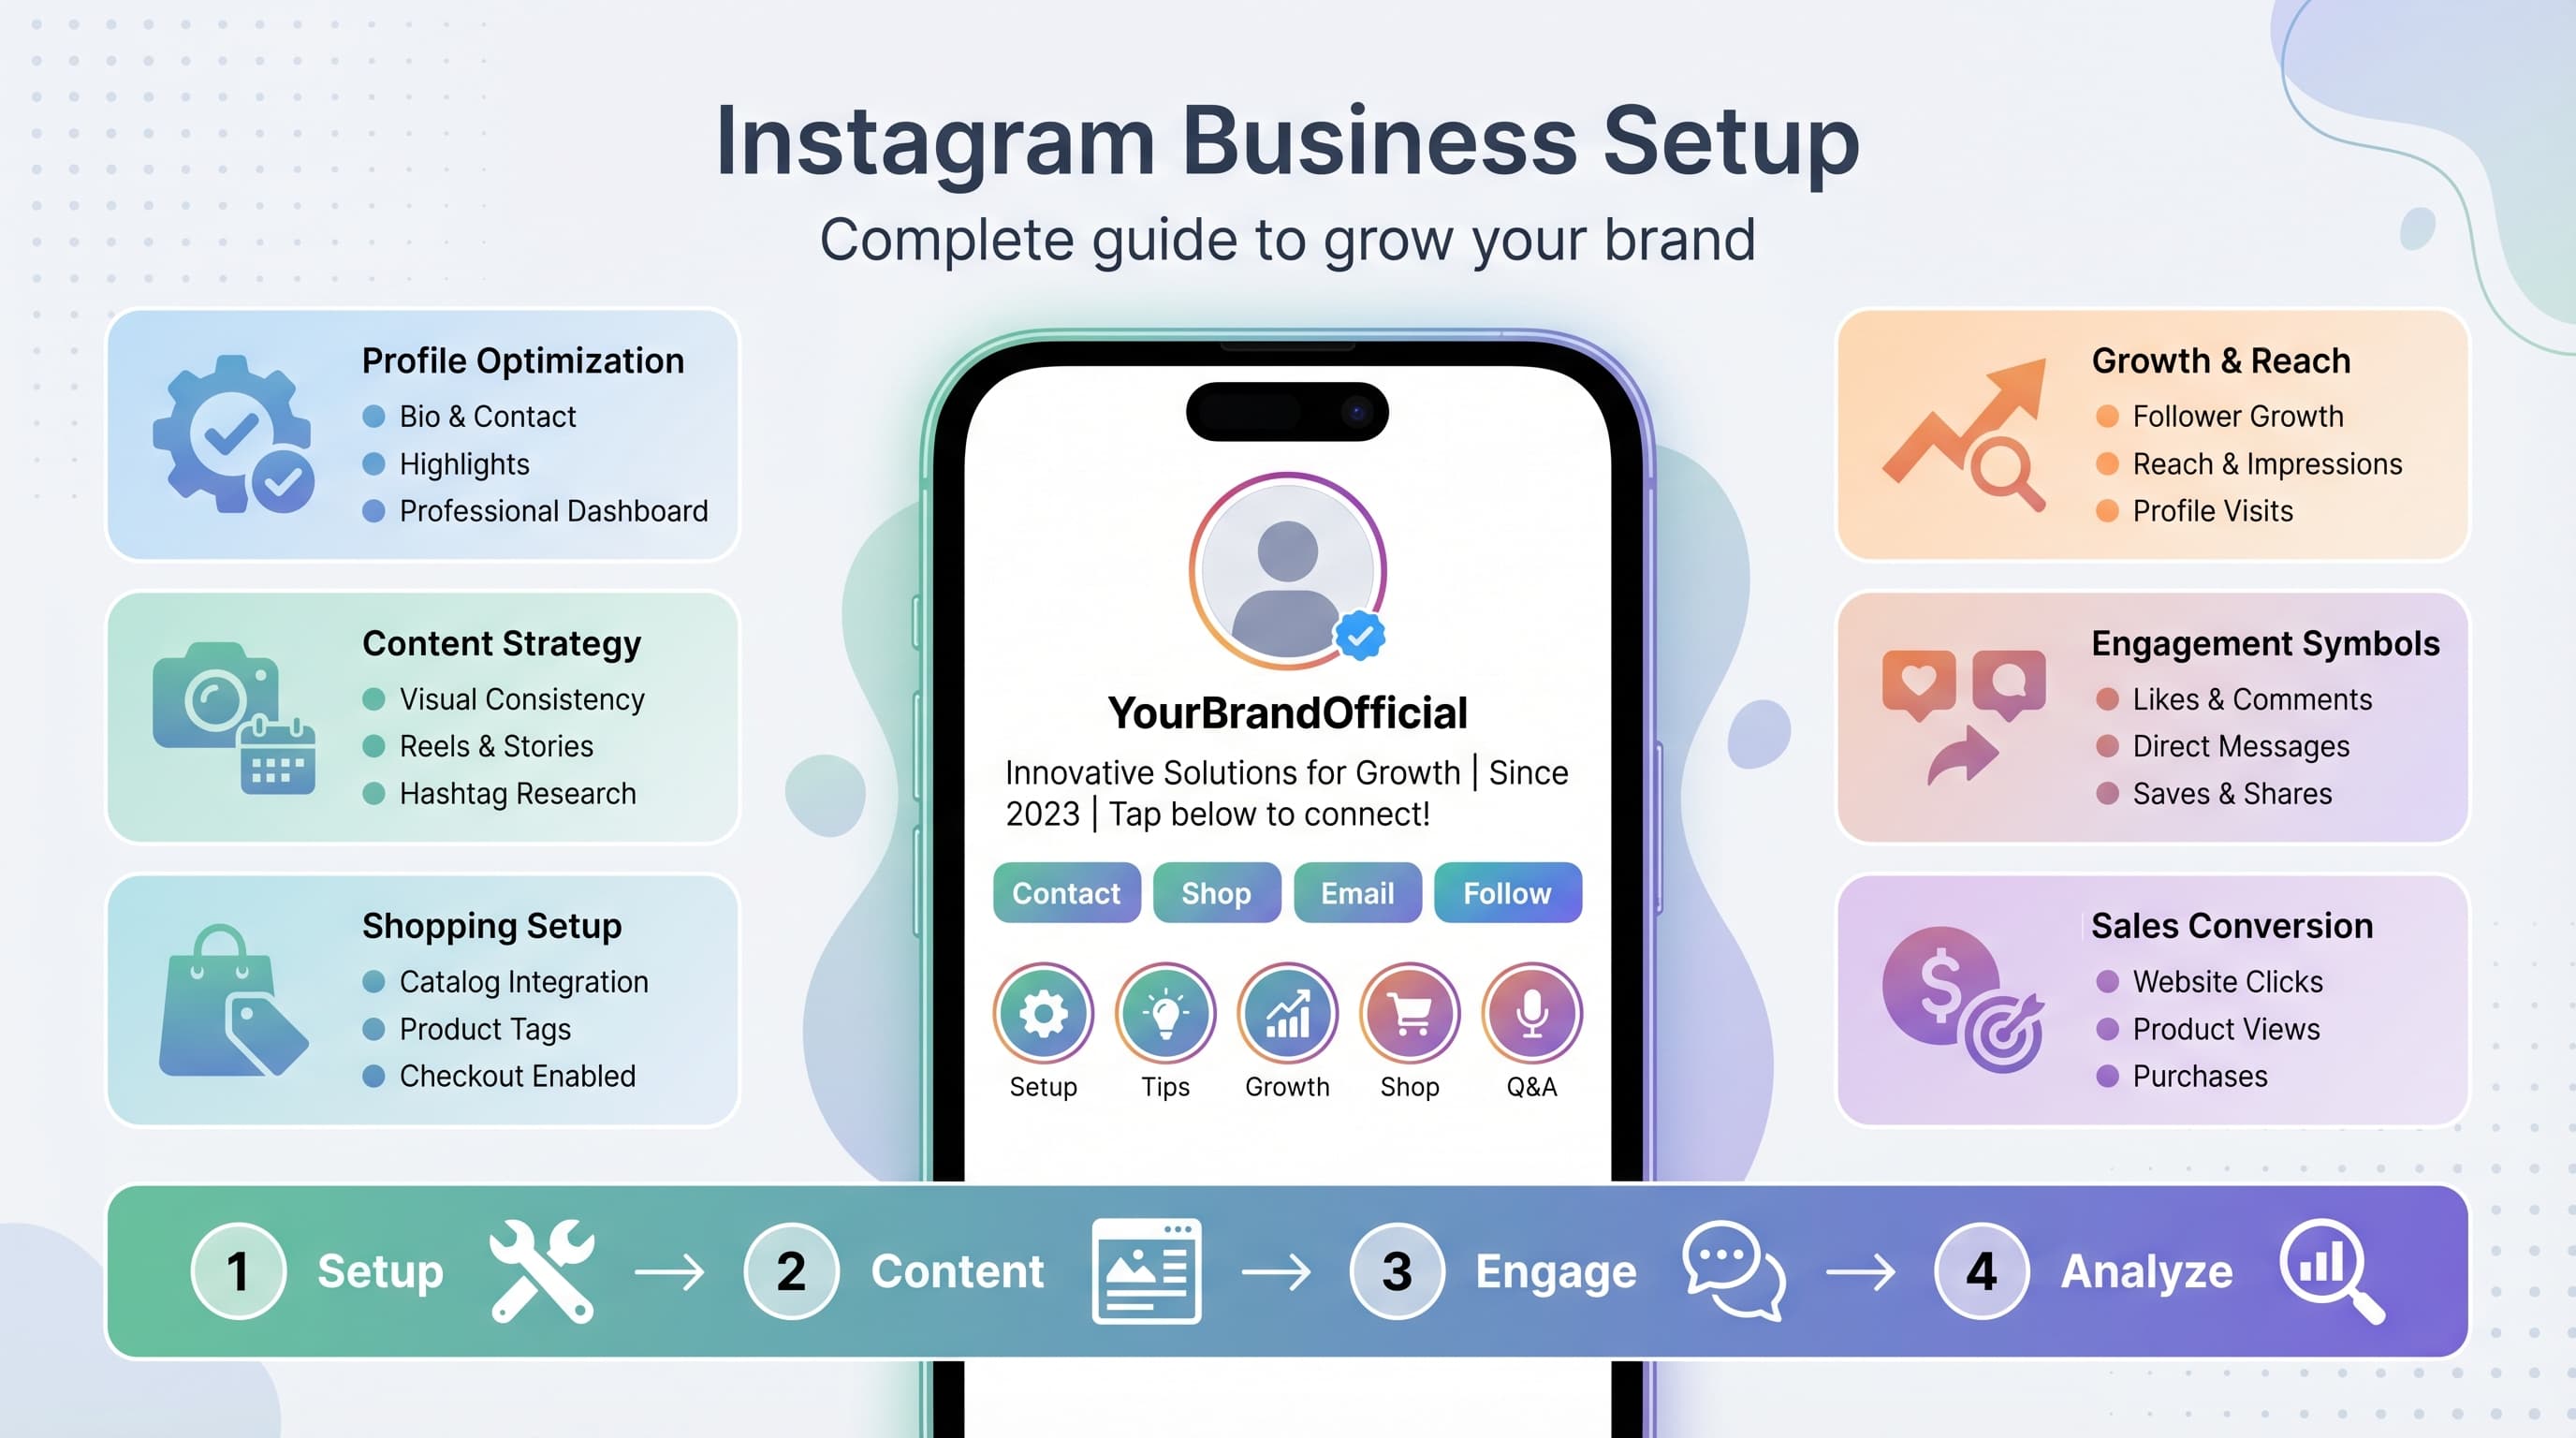
Instagram provides built-in analytics through Instagram Insights, but you need a business or creator account to access them. Personal accounts don't get detailed analytics. The switch is free and doesn't change how your account looks to followers.
Setting up Instagram Insights
Go to your profile settings and select 'Switch to Professional Account.' Choose between Creator and Business account types. Creators get slightly different features, but both provide comprehensive analytics.
Once enabled, Instagram Insights becomes available through your profile menu. The tool shows data for the past 90 days, with some metrics available for up to 2 years. Instagram updates most metrics in real-time, though some reports have a 24-48 hour delay.
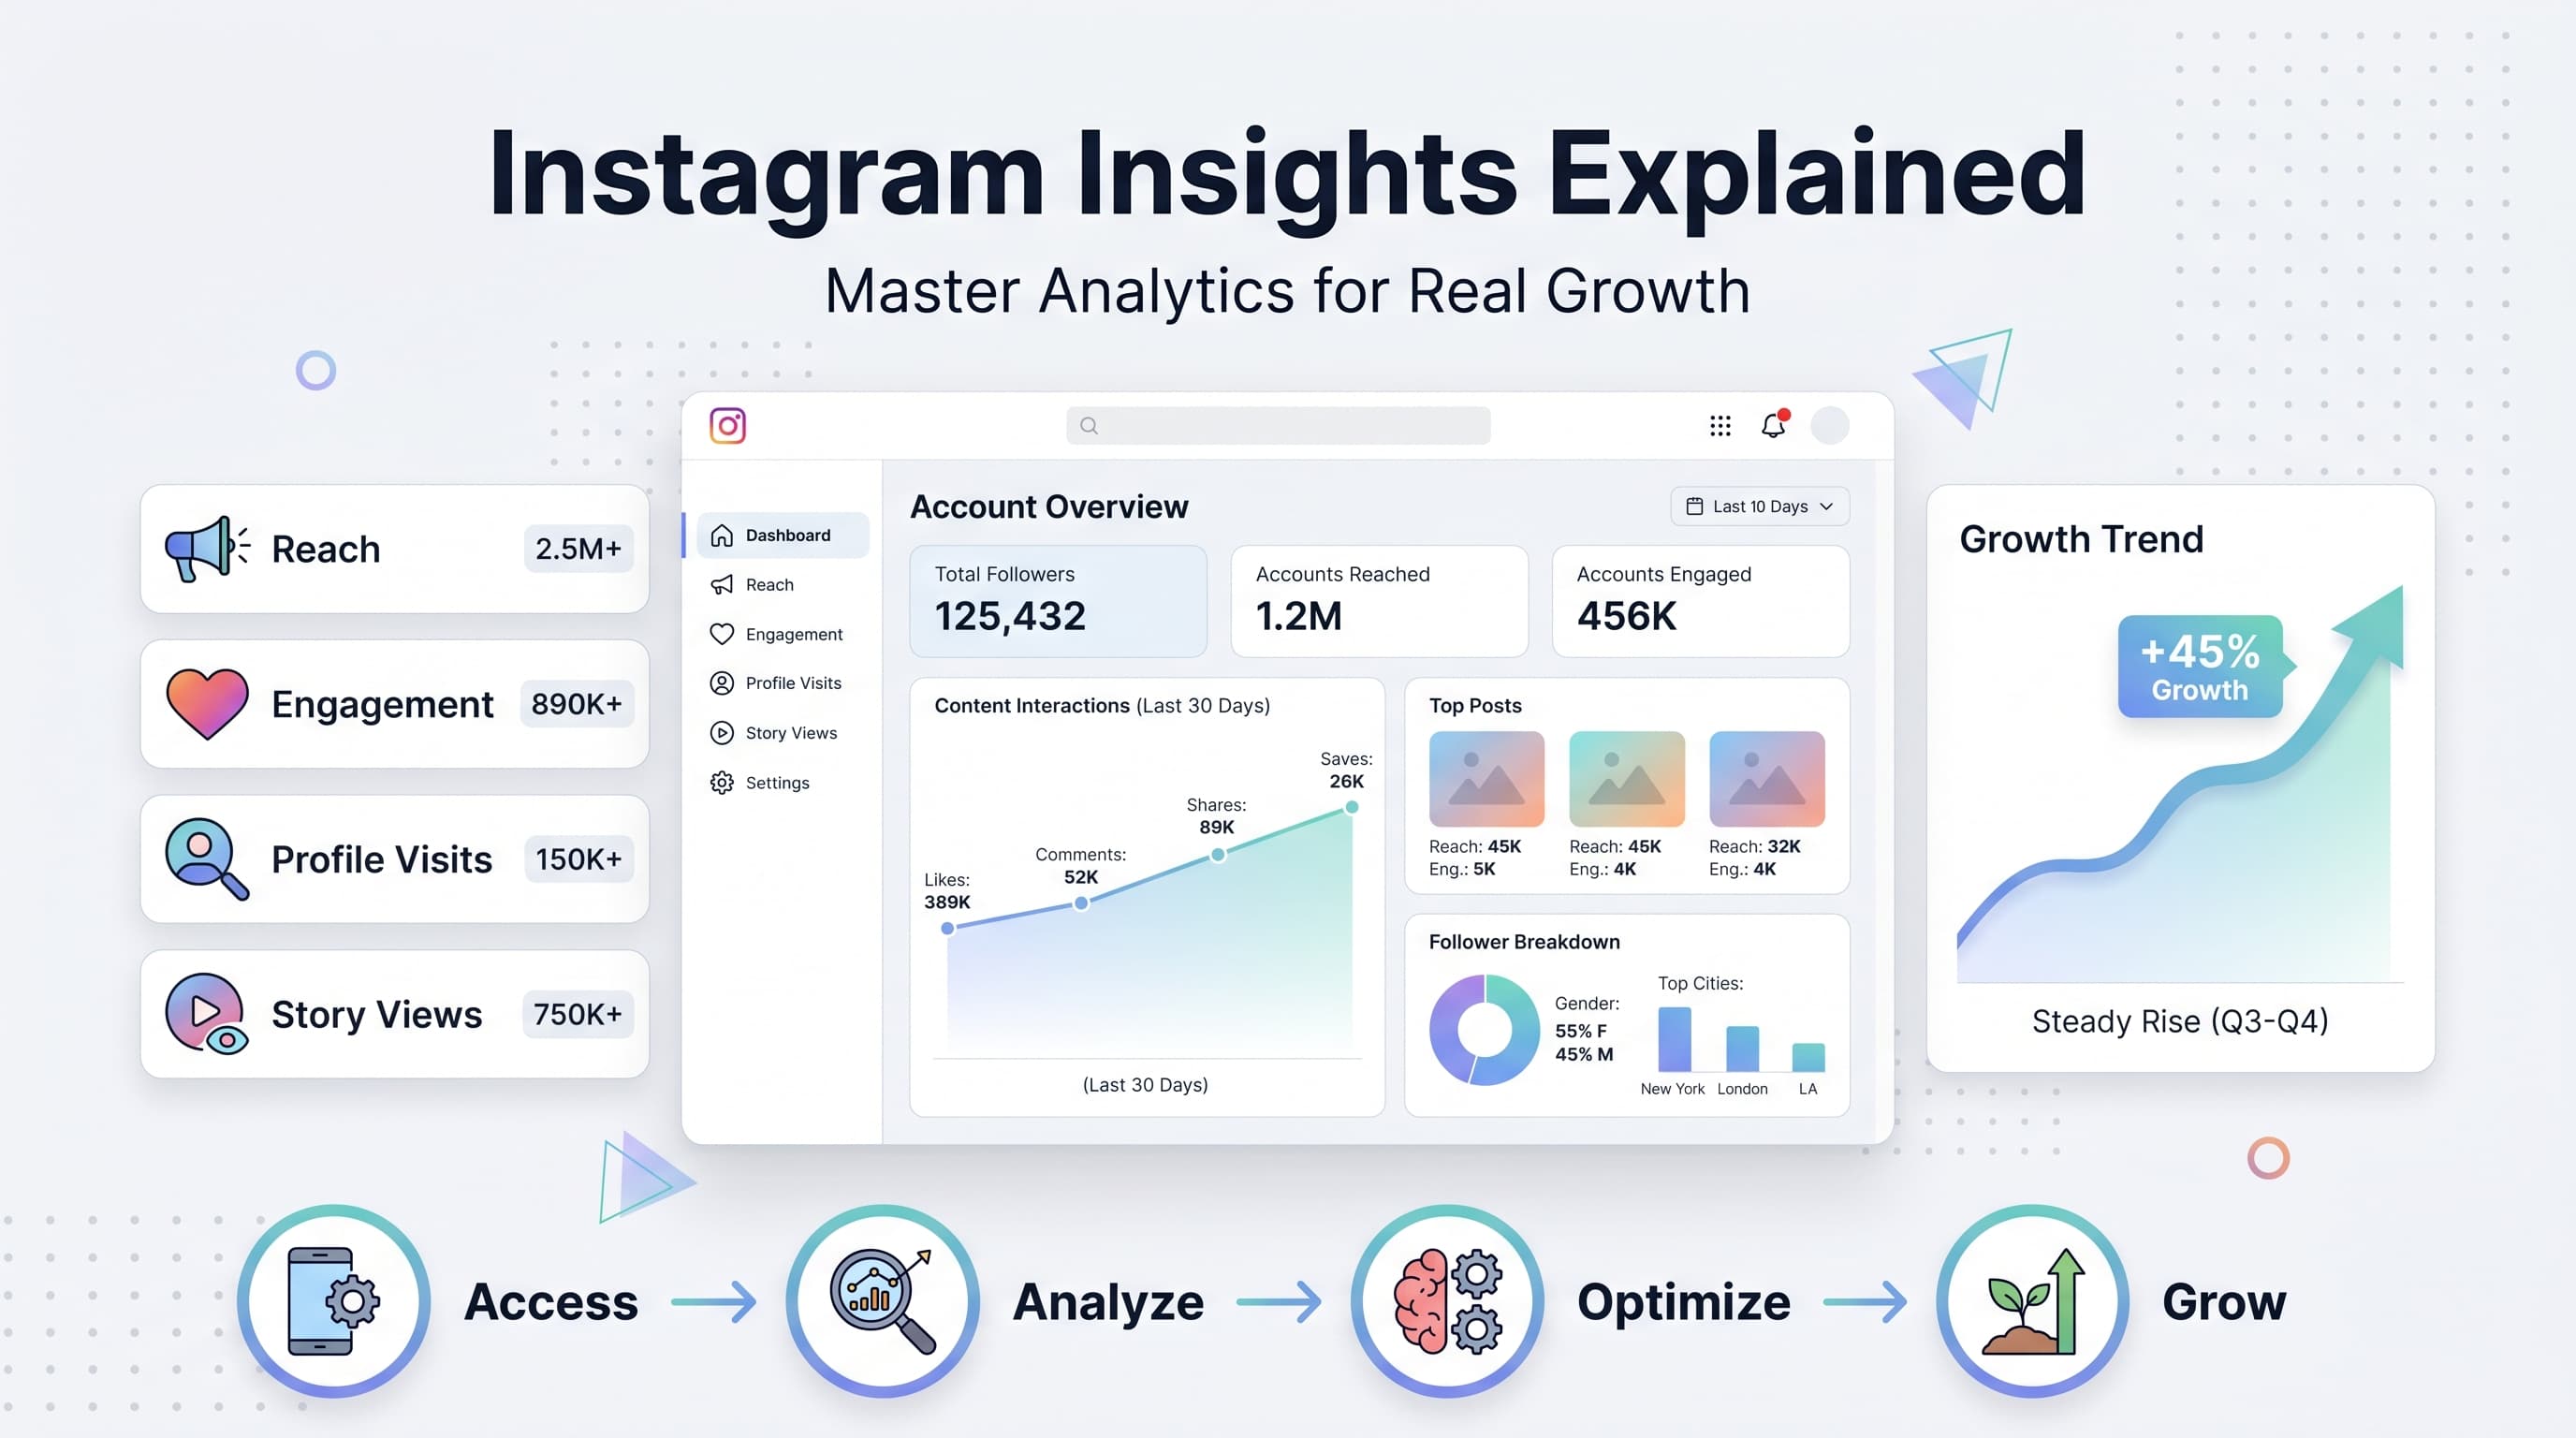
Understanding the Instagram Insights interface
Instagram Insights has three main sections: Overview, Content, and Audience. The Overview shows high-level metrics for your account performance. Content breaks down individual post and story performance. Audience provides demographic and behavioral data about your followers.
The Overview tab is your starting point. It shows accounts reached, content interactions, and total followers for whatever time period you select. You can filter by 7 days, 30 days, or 90 days to spot trends.
Content performance appears in the second tab. Here you'll find detailed metrics for individual posts, stories, reels, and IGTV videos. This is where you'll spend most of your time analyzing what works and what doesn't.
The Audience tab reveals who follows you and when they're active. Use this data to optimize your posting schedule and content strategy. You'll see age ranges, gender splits, top locations, and peak activity hours.
Third-party analytics tools worth considering
While Instagram Insights covers the basics, third-party tools provide deeper analysis and historical data. Sprout Social, Hootsuite, and Later offer advanced Instagram analytics with competitive analysis and automated reporting.
These tools excel at tracking metrics over time, comparing performance across multiple accounts, and providing industry benchmarks. Most charge monthly fees, but the investment pays off if you're serious about Instagram growth.
For content creators and small businesses, tools like Schedulala combine analytics with content scheduling. You can track performance and plan future posts in the same platform, streamlining your workflow.
Reading Instagram analytics like a pro
Raw numbers don't tell the whole story. You need context, trends, and comparisons to make smart decisions. Here's how to interpret your Instagram data for actionable insights.
Look for patterns, not individual post performance
One viral post doesn't mean your strategy is perfect. One flop doesn't mean you should panic. Look at performance over 10-20 posts to identify real trends. Download your data to a spreadsheet for easier pattern spotting.
Track metrics by content type. Do your educational carousel posts consistently outperform single-image quotes? Are behind-the-scenes videos driving more profile visits than polished product shots? These patterns guide your content strategy.
Time patterns matter too. Maybe your Monday posts consistently underperform while Thursday content gets great engagement. Or perhaps your morning posts reach fewer people than afternoon content. Adjust your posting schedule based on these patterns.
Compare apples to apples
Don't compare a Sunday post to a Wednesday post and draw conclusions about content quality. Different days, times, and even seasons affect performance. Compare similar content posted under similar conditions.
Account for external factors too. Posts during major news events, holidays, or industry conferences often perform differently. Keep notes about what's happening when you post so you can contextualize the data later.
Benchmark against yourself, not others. An engagement rate that's low for a mega-influencer might be excellent for a small business. Focus on beating your own averages rather than matching someone else's numbers.
Focus on ratios, not raw numbers
A post with 100 likes and 1,000 reach (10% engagement rate) performed better than one with 500 likes and 10,000 reach (5% engagement rate). Ratios normalize performance across different audience sizes and reach levels.
This is especially important as your account grows. Your raw numbers will increase, but your rates might decline. Don't panic if your 50,000-follower account gets lower engagement rates than when you had 5,000 followers. That's normal and expected.
Calculate these key ratios for every post: engagement rate (total engagements ÷ reach), save rate (saves ÷ reach), comment rate (comments ÷ reach), and profile visit rate (profile visits ÷ reach). Track these in a spreadsheet to spot trends over time.
Watch for leading indicators of problems
Declining reach often predicts other problems. If your recent posts are reaching fewer people, investigate why. Are you posting at different times? Has your content quality changed? Are you using banned hashtags?
Dropping engagement rates signal algorithm problems or audience mismatch. If your engagement rate falls 20%+ below your average for several posts in a row, something needs to change. Don't wait for follower count to drop before taking action.
Rising unfollow rates after posts indicate content-audience mismatch. Check which posts drive the most unfollows and analyze what they have in common. You might be alienating your core audience while chasing new followers.
Turning analytics into actionable improvements
Data without action is just numbers. Here's how to turn Instagram analytics insights into concrete content strategy improvements.
Content optimization based on top performers
Analyze your top 10 performing posts from the past 90 days. Look beyond surface-level similarities to find deeper patterns. Maybe they all ask questions in the caption. Or they feature people instead of products. Or they use specific color schemes.
Create a template based on these high-performers. If carousel posts with educational content consistently outperform single images, shift more of your content toward carousels. If behind-the-scenes videos drive profile visits, incorporate more personal content.
Don't just copy successful posts. Extract the underlying principles and apply them to new content. Maybe your most successful post was about a specific topic, but the real lesson is that controversial opinions drive engagement.
Posting schedule optimization
Use Instagram Insights to identify when your audience is most active. The Audience tab shows peak activity hours and days. But don't just post when everyone else is posting. Sometimes off-peak times have less competition and better reach.
Test posting at different times systematically. Try posting 2 hours earlier or later than usual for a week and compare performance. Account for time zones if your audience is geographically diverse.
Consider posting frequency too. Some accounts perform better with daily posts, others with 3-4 times per week. Monitor how posting frequency affects your average reach and engagement rates.
Hashtag strategy refinement
Track which hashtags appear on your best-performing posts. Instagram doesn't provide hashtag-specific analytics, but you can manually track correlation between hashtag sets and performance.
Mix hashtag sizes strategically. Use a few large hashtags (1M+ posts), several medium hashtags (100K-1M posts), and many small hashtags (under 100K posts). Small hashtags often drive more engaged audiences.
Rotate hashtag sets to avoid being flagged as spam. Create 5-10 different hashtag groups for your content types and rotate them. Avoid using the exact same 30 hashtags on every post.
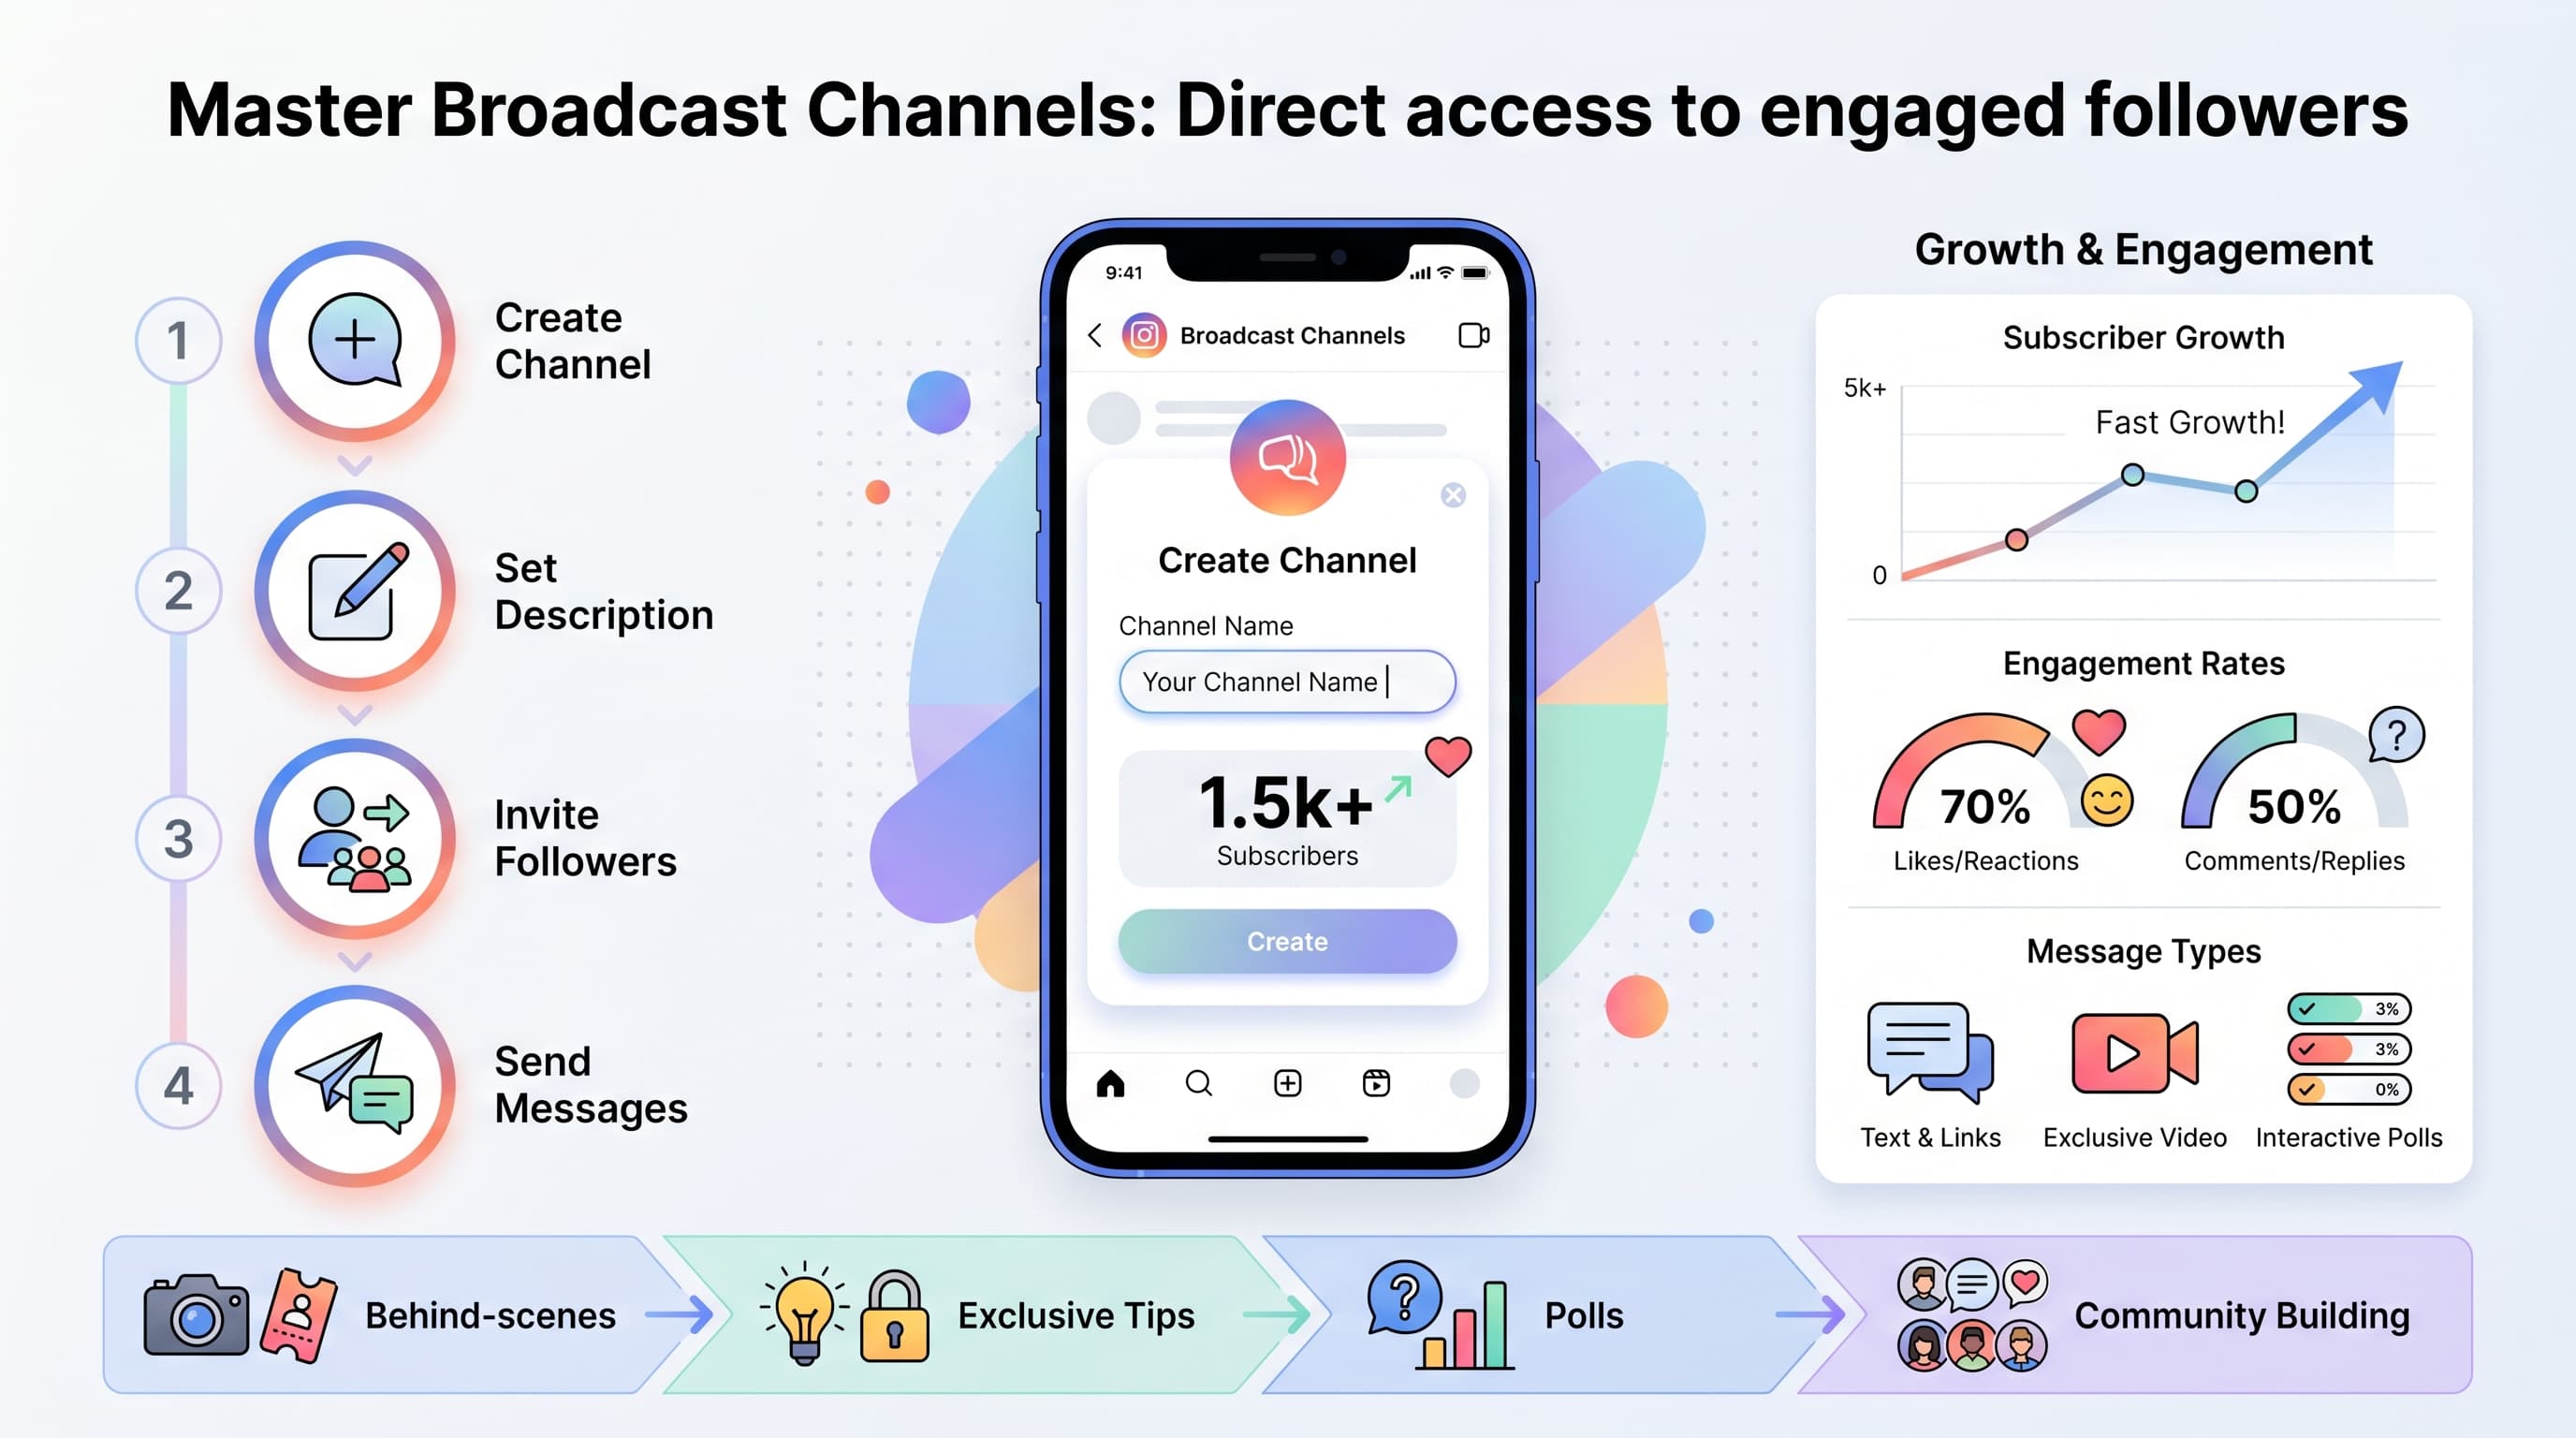
Story strategy improvements
Stories often get higher reach than feed posts, making them valuable for audience building. Use story insights to optimize length, content type, and posting frequency. Track which stories drive the most profile visits and DMs.
Interactive story features (polls, questions, quizzes) typically get higher engagement and reach. But don't overuse them. Balance interactive content with valuable information and behind-the-scenes glimpses.
Use story highlights strategically. Your best-performing stories should be saved to highlights for new followers to discover. Organize highlights by topic to make your profile more navigable.
Audience development tactics
Analyze which content types drive the most profile visits and follows. Usually, it's content that showcases your expertise, personality, or unique perspective. Generic content rarely converts viewers to followers.
Look at your audience demographics in Instagram Insights. Are you attracting the right people for your goals? If you're targeting business owners but attracting college students, your content strategy needs adjustment.
Track follower quality over quantity. Engaged micro-audiences often provide more business value than large passive audiences. Focus on attracting followers who regularly engage with your content.
Common Instagram analytics mistakes to avoid
Even experienced creators make these analytics mistakes that lead to poor decision-making and wasted effort.
Mistake 1: Obsessing over vanity metrics
Likes and follower count feel good but don't predict success. An account with 100K followers and 1% engagement rate is performing worse than one with 10K followers and 5% engagement. The algorithm favors engagement over size.
Instead, focus on metrics that correlate with your goals. If you want to drive website traffic, track link clicks and profile visits. If you want to build authority, track saves and shares. If you want sales, track conversion rates from Instagram traffic.
Mistake 2: Making decisions based on single posts
One viral post doesn't validate your entire strategy. One flop doesn't mean you should change everything. Instagram performance is inherently variable. The algorithm, timing, and external factors all influence individual post performance.
Wait for patterns across 10-20 posts before making major strategy changes. Track rolling averages to smooth out day-to-day variations. This gives you a clearer picture of what's actually working.
Mistake 3: Ignoring audience timing data
Many creators post when it's convenient for them rather than when their audience is active. Instagram Insights shows exactly when your followers are online. Use this data to optimize your posting schedule.
But don't blindly follow the 'best times to post' articles you see online. Those are averages across all accounts. Your specific audience might behave differently based on their demographics, time zones, and lifestyle patterns.
Mistake 4: Not tracking business metrics
Instagram analytics show content performance, but they don't track business results. Connect your Instagram activity to revenue, leads, email signups, or whatever matters for your goals. Use UTM codes and conversion tracking to measure ROI.
Set up Google Analytics goals for Instagram traffic. Track which types of Instagram content drive the most valuable visitors. This data helps you focus on content that actually grows your business, not just your engagement rate.
Building your analytics routine
Consistent analytics review is more valuable than sporadic deep dives. Here's how to build sustainable analytics habits that actually improve your Instagram performance.
Check your analytics weekly, not daily. Daily fluctuations are normal and don't indicate meaningful trends. Weekly reviews give you enough data to spot patterns without getting overwhelmed by noise.
Focus on different metrics each week. Week 1: content performance and engagement rates. Week 2: audience growth and demographics. Week 3: story performance and highlights. Week 4: overall account trends and goal progress. This rotation ensures you don't miss important insights.
Document your findings in a simple spreadsheet or note-taking app. Track your top-performing content, successful strategies, and lessons learned. This becomes your personal Instagram playbook over time.
Set specific goals for each quarter and track progress monthly. Instead of vague goals like 'grow my Instagram,' set measurable targets like 'increase average engagement rate from 3% to 4%' or 'drive 500 monthly website clicks from Instagram.'
Use scheduling tools that provide analytics integration. Platforms like Schedulala let you plan content and track performance in the same interface, making it easier to connect strategy with results. You can see which scheduled content performs best and adjust your content calendar accordingly.
The goal isn't to become an analytics expert. It's to make smarter content decisions based on data rather than guesswork. Even 15 minutes of weekly analytics review will dramatically improve your Instagram results over time.
Try Schedulala for free
Schedule posts to Bluesky, Twitter, and 8 other platforms from one dashboard.
Get started for free→