Social Media Report Template: 8 Free Options Worth Using in 2026
Compare 8 free social media report templates for Sheets, Canva, Notion, and PowerPoint, plus what every good report needs.

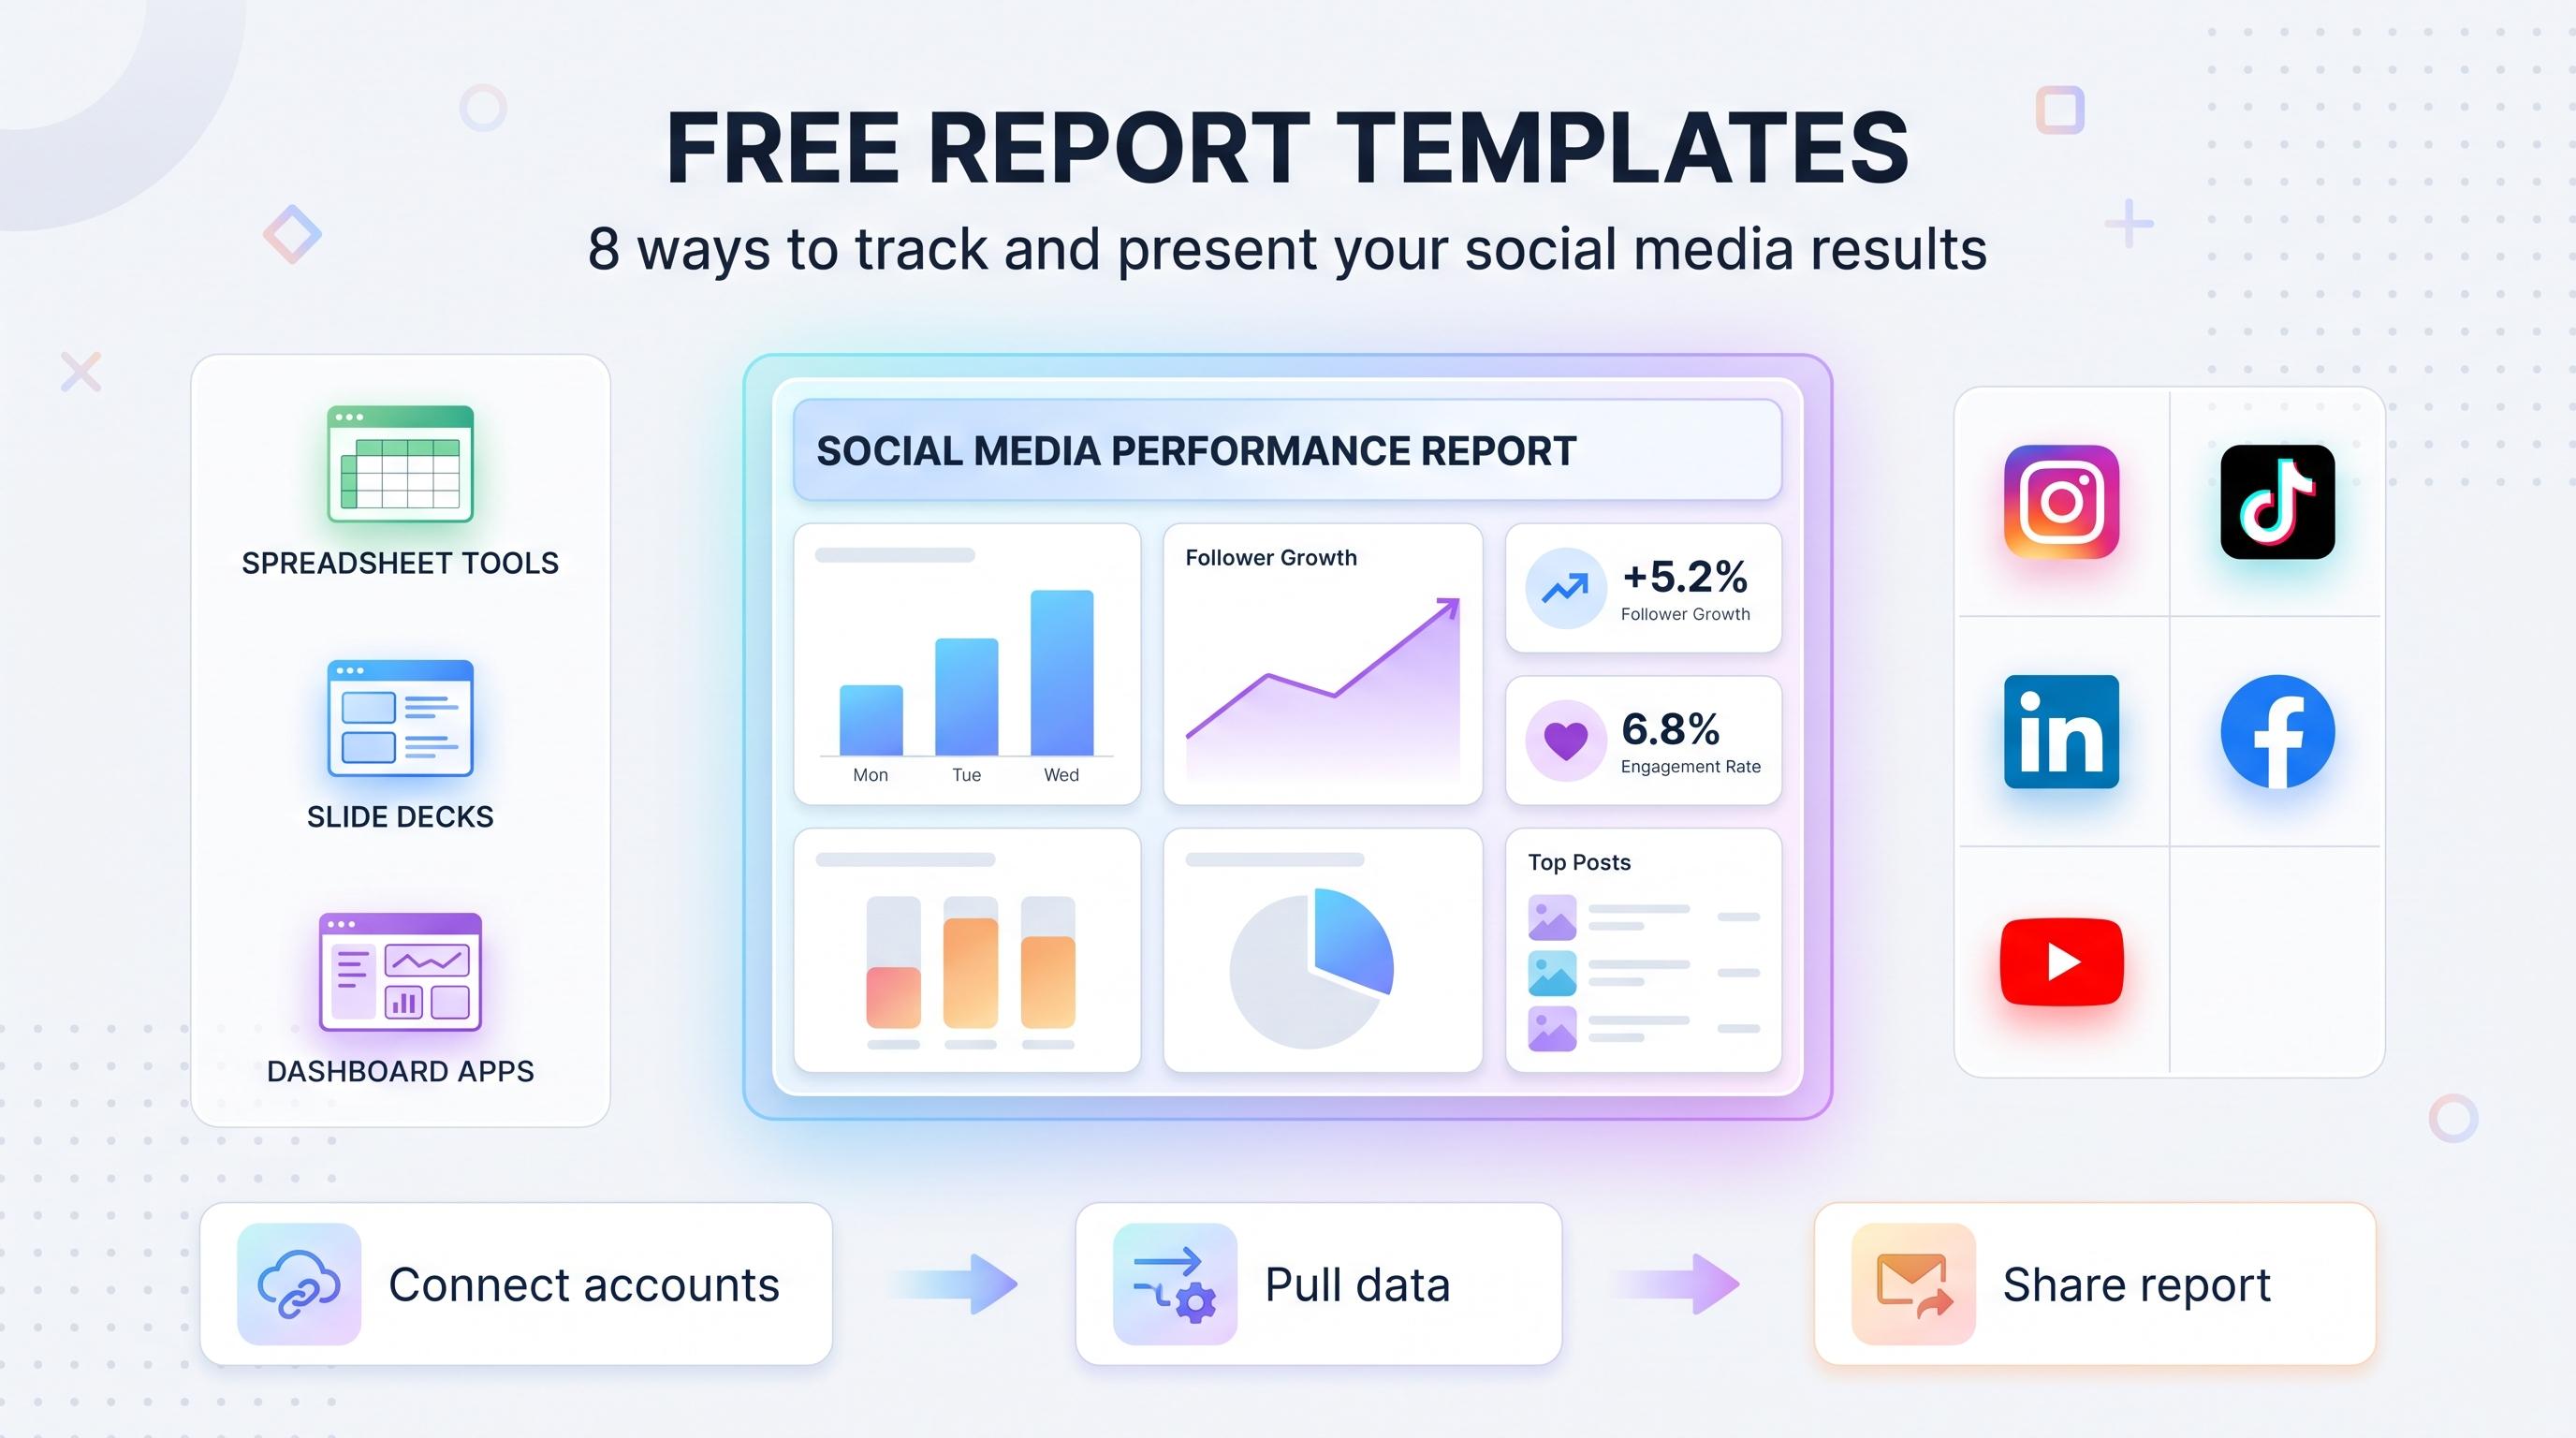
You know the Friday scramble. Your client or your boss wants numbers, and you're copying follower counts out of four different apps into a spreadsheet that nobody enjoys looking at. A good social media report template fixes this, but a bad one just moves the pain around. Learn more about Instagram scheduling.
See It in Action
This is what scheduling an Instagram post looks like in Schedulala
I pulled together the templates that actually get used, not the ones that look nice in a demo video and then sit unopened in a shared drive. Some are spreadsheets, some are design tools, one is a dashboard app. All of them are free to start, and I'll tell you where each one breaks down so you don't find out the hard way during a client call. Our social media automation can help.
Try Schedulala for free
Schedule posts to Bluesky, Twitter, and 8 other platforms from one dashboard.
Get started for free→What makes a report template actually work
Before the list, a quick gut check. The best template for your team depends on who's reading the report. A solo creator tracking personal growth needs something fast and visual. A marketing agency sending monthly updates to 15 clients needs something that scales without 15 hours of manual data entry. Keep your audience in mind as you pick from the options below. See our how to automate bluesky guide.
I ranked these by how little manual work they require once you've set them up, because the template itself is never the hard part. Pulling the numbers and keeping the format consistent month over month is where most people quit. See our 25 free instagram post guide.
8 free social media report templates worth trying
1. Google Sheets monthly performance template
Google Sheets is still the default for a reason: it's free, collaborative, and every platform's export data drops into it without a fight. A basic monthly template typically has tabs for each platform (Instagram, TikTok, LinkedIn, and so on), a summary tab pulling key numbers with simple formulas, and a notes column for context like 'launched new product line on the 14th.'. See our best time to post on instagram guide.
The upside is flexibility. You can build it to track exactly what matters to your brand, whether that's reach, saves, or link clicks. The downside is that someone has to manually export CSVs from each platform and paste them in every single month, which gets old fast if you're managing more than two or three accounts. Our instagram engagement calculator can help.
- Best for: solo marketers and small teams managing 1 to 3 accounts
- Setup time: 20 to 30 minutes for a basic version
- Biggest limitation: manual data entry doesn't scale
2. Canva social media report template
Canva's free template library has dozens of social media report designs built for client-facing presentations. These are heavy on visuals: bar charts, pie charts, brand color blocks, and placeholder sections for 'top performing post' screenshots. If your client cares more about how the report looks than the raw data behind it, this is a strong pick.
The catch is that Canva templates are static. You're still manually typing in every number and swapping out every screenshot by hand. For a single client or a quarterly deep dive, that's fine. For 10 clients every month, it turns into a part-time job.
3. Notion social media dashboard template
Notion templates work well if your team already lives inside Notion for content calendars and campaign planning. A typical setup uses a database with one row per post, properties for platform, publish date, and engagement metrics, and a linked view that filters into a monthly summary.
What I like here is the ability to connect reporting directly to your content plan, so you can see at a glance which content types or posting days actually drove results. The downside: Notion doesn't pull live data from social platforms on its own, so you're still entering numbers by hand unless you build a custom integration with something like Zapier or Make.
4. Microsoft Excel quarterly report template
If your company runs on Microsoft 365 instead of Google Workspace, Excel's built-in templates (and the free ones from Microsoft's own template gallery) cover the same ground as the Google Sheets option, with a bit more horsepower for pivot tables and advanced charting.
This one's a solid choice for finance-adjacent marketing teams who already report quarterly revenue and KPI data in Excel, since you can keep the format consistent across departments. It has the same manual data entry issue as Sheets, just with a more corporate look and feel.
5. HubSpot free social media report template
HubSpot publishes a downloadable social media reporting template (usually a PowerPoint or Sheets file) aimed at marketing teams that need to justify budget. It leans heavily into business metrics: cost per follower, conversion attribution from social traffic, and ROI framing rather than just vanity metrics.
This is the template to grab if your audience is an executive who doesn't care how many likes you got and only wants to know what social spend is doing for pipeline. It requires more setup because you need traffic and conversion data from an analytics tool on top of your platform-level stats, but the framing is genuinely useful for budget conversations.
6. Canva Instagram-specific report template
A few Canva templates are built specifically around Instagram's metrics (reach, profile visits, story taps forward versus back, saves). If Instagram is where most of your budget and attention goes, a platform-specific template can go deeper than a generic multi-platform one, because the sections map directly to what Instagram's own insights panel shows you.
The tradeoff is obvious: you'll need a separate template (or separate section) for every other platform you're active on, which can get messy fast if you're juggling five or six accounts.
7. PowerPoint agency client report template
Agencies sending reports to external clients often lean on PowerPoint because it's the format most client stakeholders expect in a meeting. Free versions typically include an executive summary slide, a metrics-at-a-glance slide, a top content slide with screenshots, and a 'next month's focus' slide.
This format is great for the actual client meeting, but it's the most time-consuming to build from scratch each month. Screenshotting top posts, resizing images, and formatting slides eats hours that could go toward actual strategy work.
8. A scheduling tool's built-in analytics export
This isn't a downloadable template in the traditional sense, but it's worth including because it solves the actual root problem: manual data entry. Scheduling and analytics platforms that connect directly to your social accounts can pull live performance data and export it into a report format automatically, without the copy-paste step.
Schedulala, for example, connects across all 12 supported platforms (Instagram, TikTok, Twitter/X, LinkedIn, YouTube, Facebook, Threads, Bluesky, Pinterest, Telegram, Mastodon, and Google Business Profile), so the reporting data is already sitting next to your published posts instead of scattered across a dozen native apps. If you're spending more time formatting spreadsheets than analyzing results, this is the category of tool to look into next.
Template comparison at a glance
| Template type | Setup time | Automation level | Best for |
|---|---|---|---|
| Google Sheets | 20-30 min | Manual | Small teams, flexible tracking |
| Canva (multi-platform) | 30-45 min | Manual | Visual, client-facing reports |
| Notion dashboard | 45-60 min | Low (needs integration) | Teams already in Notion |
| Excel | 20-30 min | Manual | Microsoft-based teams |
| HubSpot | 45-60 min | Manual | Budget/ROI conversations |
| Canva (platform-specific) | 20-30 min | Manual | Single-platform deep dives |
| PowerPoint agency deck | 60-90 min | Manual | Client presentations |
| Scheduling tool export | 10-15 min | Automatic | Teams managing multiple accounts |
What every good social media report needs
Whichever template you pick, the content matters more than the design. I've reviewed a lot of reports that look polished and say almost nothing useful. Here's what actually belongs in there.
- A goal, stated at the top. Not 'grow engagement' in the abstract, but something like 'increase LinkedIn impressions 15% this quarter.' Reports without a stated goal read like a list of random facts.
- Followers/subscribers, with growth rate, not just total. A raw follower count tells you almost nothing month to month. The growth rate (or decline) tells you if something's working.
- Engagement rate per platform. Raw likes are easy to game with a boosted post. Engagement rate relative to reach or followers is a much more honest number.
- Top 3 to 5 performing posts, with a one-line reason why. 'This carousel got 3x average reach because it used a trending audio clip' is useful. A screenshot with no commentary is not.
- Posting consistency. How many posts went out versus how many were planned. Gaps in posting almost always explain dips in reach, and this context saves you an awkward conversation later.
- A short 'what we're changing next month' section. This is the single most skipped part of social media reports, and it's the part that actually justifies your time and budget.
Common mistakes people make with report templates
A few patterns show up constantly when I look at reports that don't get read past the first slide.
- Too many metrics, no hierarchy. If every number gets equal visual weight, the reader doesn't know what to look at first. Pick 3 to 5 headline metrics and push the rest into an appendix.
- Changing the format every month. Consistency matters more than perfection. If your boss or client has to relearn the layout every month, they'll skim instead of read.
- No comparison period. A number with nothing to compare it to is meaningless. Always show month-over-month or year-over-year change.
- Vanity metrics without context. 'We got 50,000 impressions' sounds great until someone asks what that actually did for the business. Tie metrics back to the stated goal whenever you can.
- Manual exports done last minute. This is the biggest time sink. If you're pulling CSVs from four platforms the night before a report is due, you're setting yourself up for errors and burnout.
When a template stops being enough
Spreadsheets and slide decks are fine when you're managing one or two accounts and reporting monthly. They start to fall apart once you're managing accounts across multiple platforms, reporting weekly instead of monthly, or sending reports to more than a handful of clients. At that point, the bottleneck isn't the template design, it's the hours spent logging into each platform, exporting data, and reformatting it by hand.
This is where a dedicated scheduling and analytics platform earns its keep. Schedulala connects to all 12 supported platforms from one place and keeps performance data attached to the posts you actually scheduled, so building a report means pulling from one dashboard instead of five logins. Every plan, including the entry-level Personal plan at $29/month for 10 social accounts, includes unlimited scheduled posts, so you're not rationing how much you publish just to stay under a cap.
For teams managing more accounts, the Team plan runs $49/month for 25 social accounts and the Agency plan is $99/month for 100 social accounts, with annual billing giving you two months free on any plan. Accounts are a flat count you can spend however you want (10 Instagram accounts, one account on each of 10 platforms, or any mix), so there's no awkward bundling by platform or per-seat fee eating into your budget as your client list grows.
If you want to test whether this actually saves you time before committing, Schedulala offers a 7-day free trial (a card is required to start it, there's no free-forever tier) so you can connect your real accounts and see what reporting looks like without the manual export step.
Try Schedulala for free
Schedule posts to Bluesky, Twitter, and 8 other platforms from one dashboard.
Get started for free→How to choose the right one for your team
If you're a solo creator or freelancer tracking your own growth, start with Google Sheets or Excel. It's free, flexible, and you don't need to convince anyone else to adopt a new tool. If you're sending reports to clients who care about visuals, Canva's templates will get you the most polish for the least design skill.
If you're managing accounts for multiple clients or multiple brands and reporting is eating a full day every month, stop patching the problem with a prettier spreadsheet. Automate the data pull first, then worry about the format. A tool that connects directly to your accounts will save you more time than any template redesign ever will.
Quick takeaways
- Pick the simplest template that matches your audience: spreadsheet for internal tracking, slides or Canva for client-facing presentations.
- Lock your headline metrics (3 to 5 max) and keep the format identical every month so readers don't have to relearn the layout.
- Always include a 'what's changing next month' section. It's the difference between a report and a list of numbers.
- If manual data entry is taking more than an hour a month, you've outgrown a static template and need a tool that pulls data automatically.
- Schedulala's 12-platform coverage and unlimited posting on every plan make it a solid option once you're ready to stop copy-pasting metrics by hand.
Try Schedulala for free
Schedule posts to Bluesky, Twitter, and 8 other platforms from one dashboard.
Get started for free→