Social Media Reporting for Clients: Templates and a Process That Doesn't Eat Your Week
Free social media reporting templates for clients, plus a repeatable process to build reports fast without wasting hours every month.

If you manage social media for clients, you already know the dread. The calendar flips to the first of the month and suddenly you're digging through five different platforms, copying numbers into a spreadsheet, and trying to turn a wall of metrics into something that sounds like it matters. Our Instagram scheduling can help.
See It in Action
This is what scheduling an Instagram post looks like in Schedulala
Most agencies and freelancers lose three to six hours per client per month just on reporting. Not strategy, not creative, just the act of pulling numbers and formatting a document. That's time you're not billing for, and it's usually the first thing that gets rushed when deadlines pile up. See our the best social media guide.
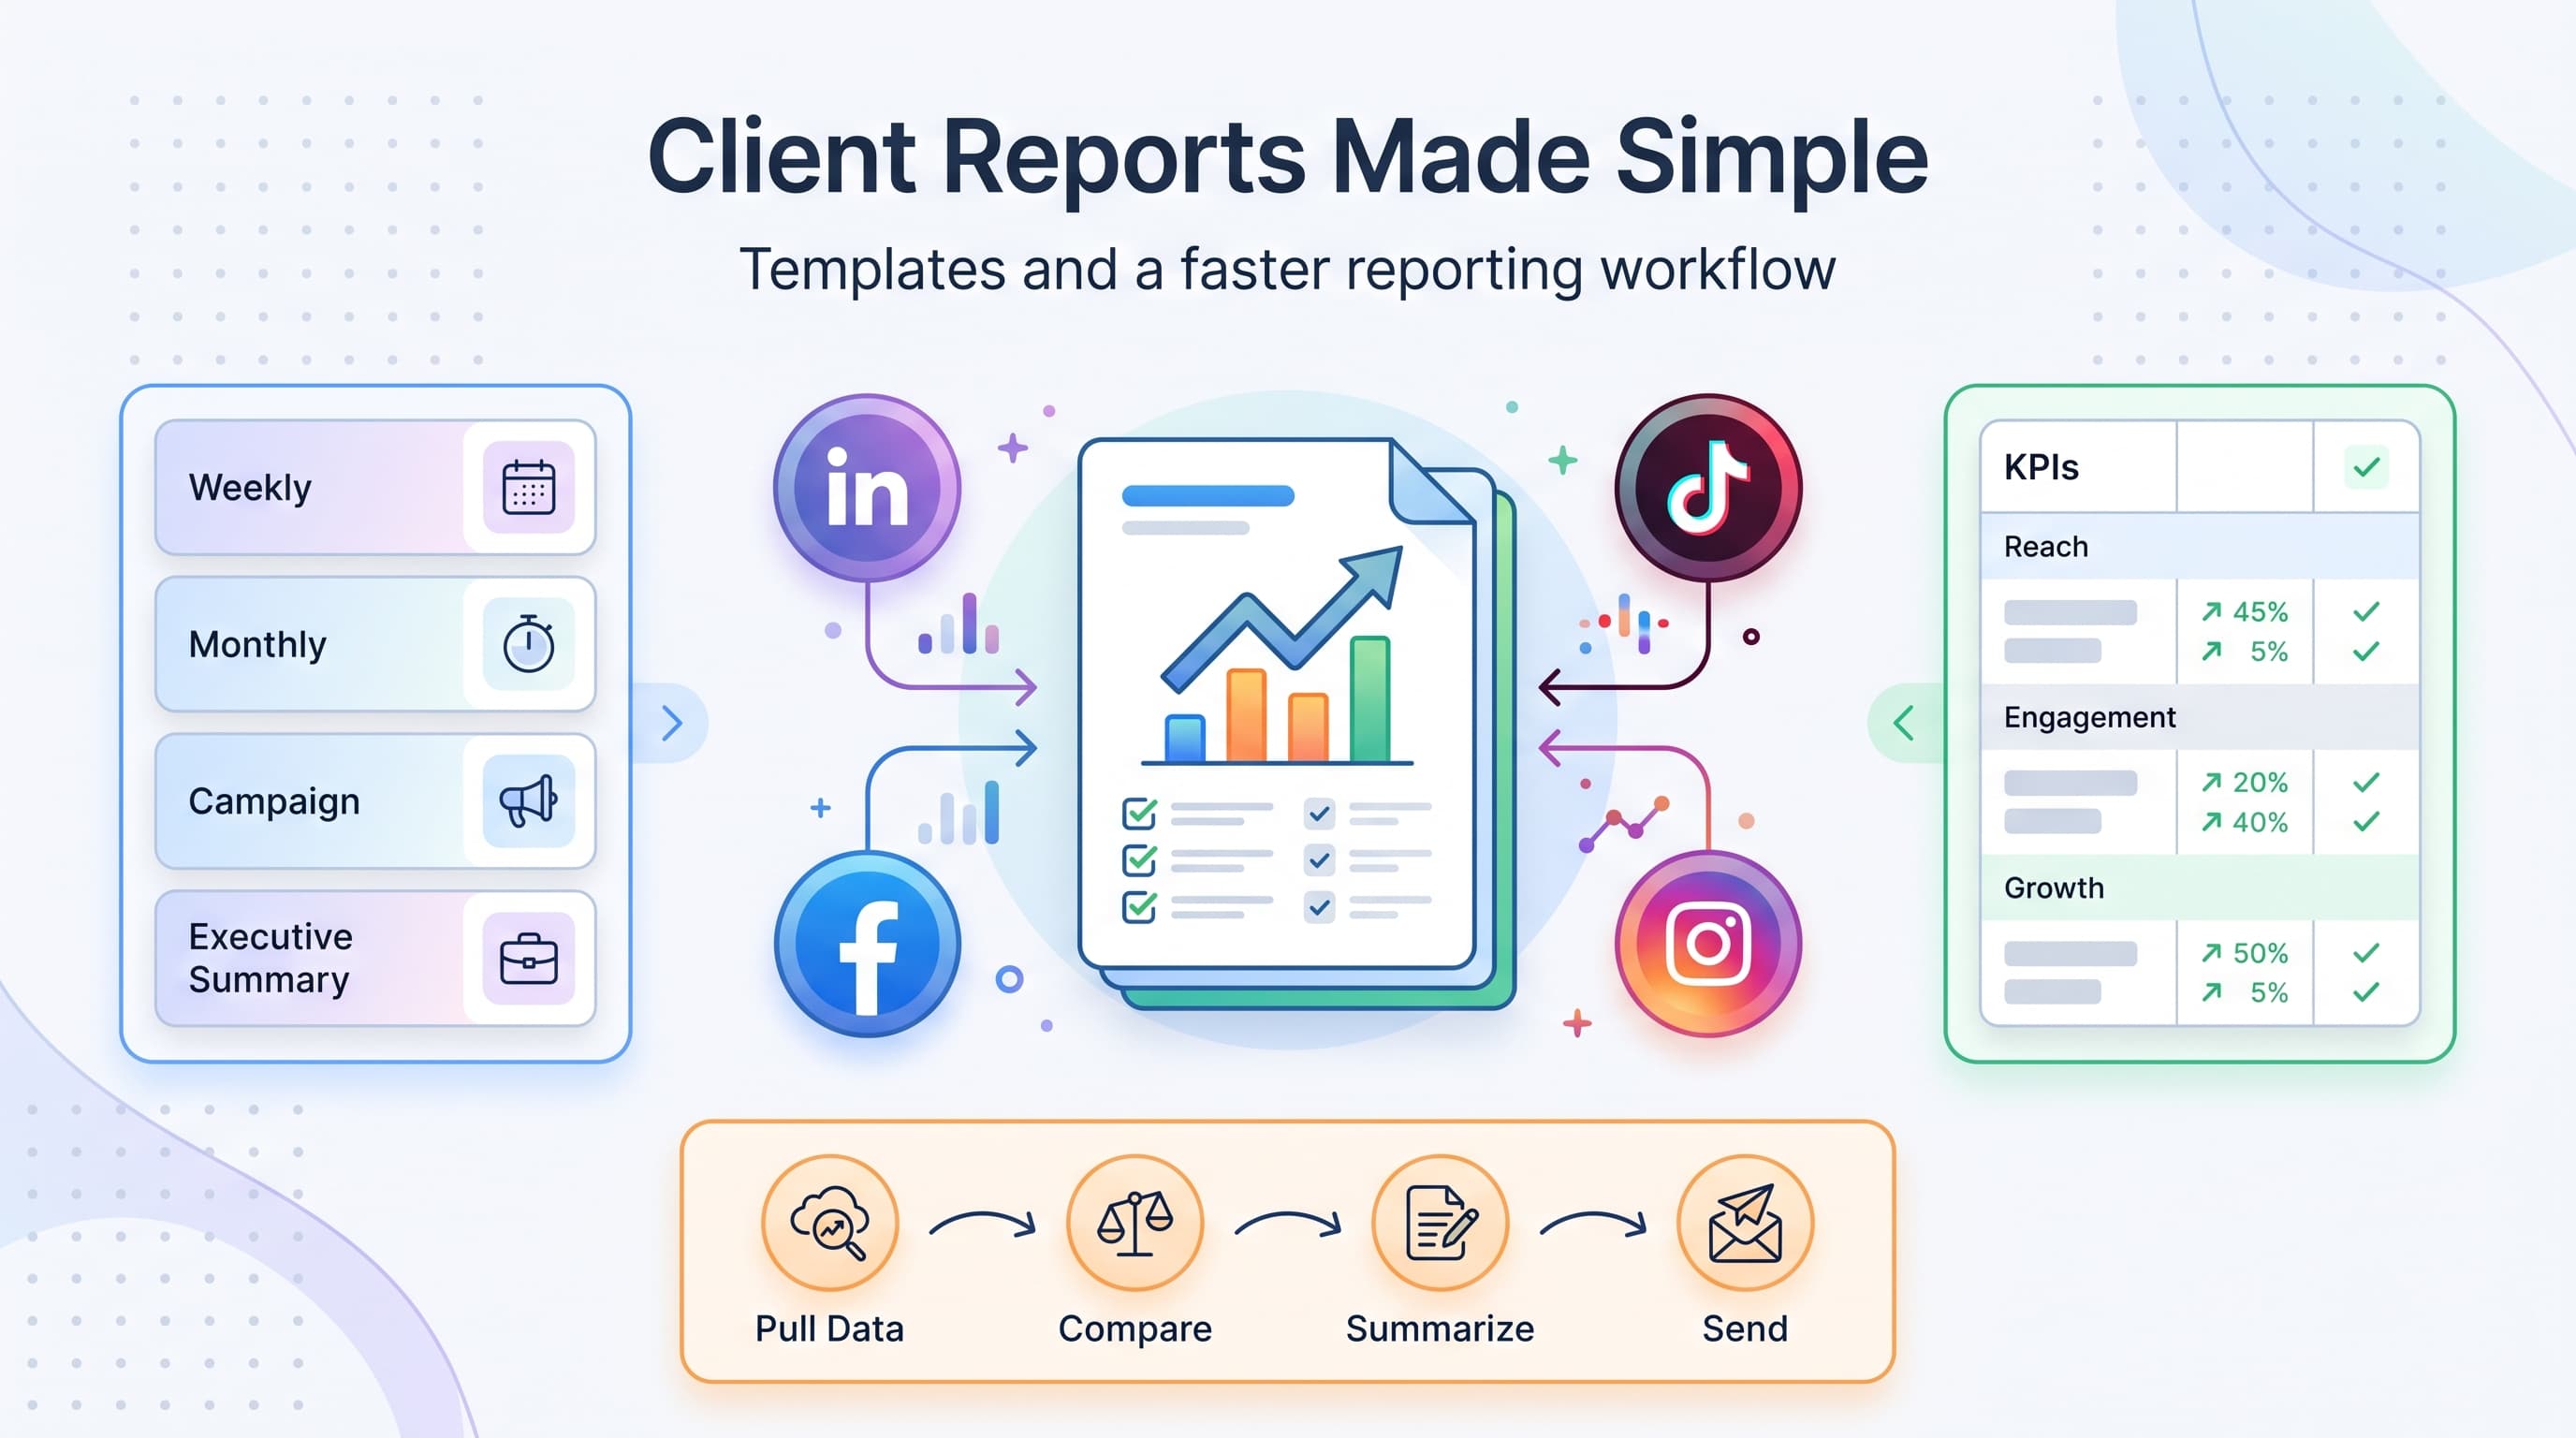
This guide gives you actual templates you can copy, a repeatable structure for every report type (weekly, monthly, campaign, executive), and a process that cuts reporting time down to 30-45 minutes per client once you have the system in place. Learn more about telegram engagement tips get.
Try Schedulala for free
Schedule posts to Bluesky, Twitter, and 8 other platforms from one dashboard.
Get started for free→Why most client reports fail before they're even sent
Before we get to templates, it's worth being honest about why reporting feels so painful. It's rarely about the data itself. It's that most reports are built backwards: the person building them opens every platform's native analytics tab, screenshots whatever looks impressive, and pastes it into a slide deck with no narrative connecting any of it. See our content calendar guide.
A client looking at a report full of charts with no context has one question: so what? Did we grow? Did this actually help the business? A report that doesn't answer that question in the first 30 seconds has already failed, no matter how polished the design is. See our best time to post on instagram guide.
The fix isn't more data. It's less data, better framed. Every template below is built around one rule: every number needs a sentence next to it explaining why it matters. If you can't explain why a metric matters to this specific client, cut it. Try our instagram engagement calculator.
What goes in every social media client report
Regardless of frequency or client type, every solid report needs five sections. Skip one and the report feels incomplete, add extras and it feels bloated. Here's the structure we recommend, in order.
1. Executive summary (3-5 sentences max)
This goes at the very top, before any chart. It answers three questions in plain language: what happened this period, was it good or bad relative to goals, and what are you doing about it next. Write this section last, after you've reviewed all the data, but place it first in the document.
Example: 'Engagement rate rose 18% this month, driven mostly by the short-form video series we launched on Instagram and TikTok. Follower growth on LinkedIn was flat, which lines up with our slower posting cadence there while we rebuilt the content calendar. Next month we're increasing LinkedIn frequency back to three posts a week.'
2. Goals and KPIs tracker
Clients forget what you agreed to measure three months ago. Restate the goal every single time, with a simple status indicator: on track, behind, or exceeded. A one-line table works better than a paragraph here.
If the client's goal was brand awareness, your KPI table should lead with reach and impressions, not likes. If the goal was lead generation, lead with link clicks, profile visits, and conversions, not follower count. Matching the KPI to the actual business goal is the single biggest differentiator between a report that gets read and one that gets skimmed.
3. Platform-by-platform performance
Break out each active platform individually. For a client running Instagram, LinkedIn, and TikTok, that's three subsections. Keep each one to the same five metrics so the client can compare period over period without relearning the format every time: followers/audience change, reach or impressions, engagement rate, top-performing post, and posting volume.
Resist the urge to add extra metrics for platforms that are performing well just because you have the data. More isn't better here. Consistency across months matters more than completeness within a single report.
4. Top content breakdown
Show the client their three best-performing posts of the period with a one-line explanation of why each one worked. This is the section clients remember and forward to their boss. It turns abstract numbers into something they can visualize and connects directly to the content you're producing.
Include the format too (reel, carousel, static image, video) so patterns become obvious over a few months. If carousels keep outperforming single images for a client, that's a finding worth calling out explicitly, not burying in a screenshot caption.
5. Next steps and recommendations
This is the section that justifies your retainer. Anyone can pull numbers. What they're paying you for is the interpretation and the plan. Three to five specific, concrete actions for next period, tied directly to what the data showed.
Avoid vague lines like 'continue optimizing content strategy.' Be specific: 'Shift 20% of the Instagram content budget from static posts to Reels based on the 3x engagement gap we saw this month' is a recommendation. 'Keep doing what's working' is not.
Four report templates, by frequency and audience
Not every client needs the same report. A client paying for a full-funnel social strategy needs something different than a small business owner who just wants to know if the money is working. Here are four templates built for the most common client situations.
Template 1: Weekly snapshot (for active campaigns)
Use this during product launches, paid campaigns, or any period where the client wants visibility more often than monthly. Keep it to one page, sent as an email with bullet points, not a formal deck.
- One-line summary of the week
- 3 key metrics vs. last week (reach, engagement, clicks)
- Top post with a screenshot
- Anything flagged for attention (comment surge, negative sentiment, a post underperforming)
- What's scheduled for next week
Template 2: Monthly standard report (most common)
This is the workhorse report, the one 80% of your clients should get. Use the five-section structure from above: executive summary, KPI tracker, platform breakdown, top content, and next steps. Format as a short slide deck (8-12 slides) or a well-organized PDF.
- Slide 1: Executive summary
- Slide 2: KPI dashboard (table format)
- Slides 3-6: Platform breakdowns (one per platform)
- Slide 7: Top 3 posts
- Slide 8: Audience insights (demographics, growth)
- Slide 9: Recommendations for next month
- Slide 10: Content calendar preview
Template 3: Campaign report (for a specific push)
Built around a single campaign rather than ongoing account management. Clients want to know the ROI of this specific effort, isolated from the rest of the account's performance.
- Campaign objective and timeframe
- Budget and spend (if paid social was involved)
- Reach and impressions during the campaign window
- Engagement and conversions attributable to the campaign
- Cost per result (per click, per lead, per follower, whichever applies)
- Comparison to the account's baseline performance before the campaign
- Lessons for the next campaign
Template 4: Executive summary (one page, for leadership)
When your contact needs to forward something up the chain to a CMO or CEO who has no time for a 12-slide deck, give them one page. This is the hardest template to write well because every word has to earn its place.
- One sentence: did social media help the business this period?
- Three numbers that prove it (and why they were chosen)
- One chart, maximum
- Three bullet points on what's next
This template works because executives don't want proof you're busy, they want proof the investment is working. Cut everything that doesn't directly answer that.
The step-by-step process for building a report in under an hour
Templates only solve half the problem. The other half is the workflow you use to fill them in every month. Here's the process we've seen cut reporting time from four hours to under an hour, once it's running on a schedule.
1. Pull the raw data first, interpret it second
Set a recurring calendar block (same day every month, like the 1st or the last business day) to pull every number before you touch the narrative. Don't try to write insights while you're still hunting for data. Separating data collection from analysis keeps you from rushing the interpretation to just get the pull done.
If your scheduling tool already shows you what posted and when, you've got half the data already in one place instead of hunting through five apps. That's one of the quiet benefits of running your posting through a single tool like Schedulala rather than posting natively on each platform and trying to reconstruct the calendar later.
2. Compare to the previous period, not just raw numbers
A number alone means nothing. 'We got 4,200 impressions' tells a client nothing. '4,200 impressions, up 22% from last month' tells a story. Always pull last period's numbers alongside this period's before you write a single summary line.
3. Write the executive summary first, even though it goes last
Once the data is pulled and compared, write the three-to-five sentence summary before building out the rest of the report. This forces you to identify the actual story of the month before you get lost formatting charts. Everything else in the report should support what you wrote in that summary.
4. Reuse the same template file every month
Don't build a report from scratch each time. Keep a master template (Google Slides, Canva, Notion, whatever your client prefers) with placeholder text and formatting already in place. You're only ever swapping numbers and rewriting the narrative, never rebuilding layout.
5. Send it with a short note, not a cold attachment
A report dropped in an email with no context gets skimmed or ignored. Two sentences in the email body highlighting the single most important thing from the month gets the client to actually open and read it. 'This month's big win was the Reels series, details inside' takes ten seconds to write and dramatically increases the odds your work gets seen.
Choosing metrics that actually match client goals
One of the fastest ways to lose a client's trust is reporting vanity metrics when they're paying for business outcomes. A table helps here, because the right metric depends entirely on what the client is actually trying to achieve.
| Client goal | Lead metrics | Vanity metrics to de-emphasize |
|---|---|---|
| Brand awareness | Reach, impressions, share of voice | Follower count alone |
| Lead generation | Link clicks, profile visits, form fills | Likes without context |
| Community building | Comment rate, reply rate, saves | Raw post count |
| Sales / e-commerce | Click-through rate, conversions, revenue per post | Reach without conversion tie-in |
| Local business foot traffic | Google Business Profile views, direction requests, local reach | National impression numbers |
This table also doubles as a conversation starter for onboarding calls. Ask new clients directly: 'When this engagement is working, what changes in your business?' Their answer tells you exactly which column of this table to build your reports around.
Common mistakes that make reports look worse than the work
Even agencies doing excellent social media work undersell themselves with weak reporting. These are the mistakes we see most often, and they're all fixable in the next report cycle.
- Screenshot-only reports. Pasting native analytics screenshots with no narrative forces the client to do the interpretation themselves, which is literally the part they're paying you for.
- Reporting on everything instead of what was agreed. Adding metrics the client never asked about dilutes the ones that matter and makes the report feel padded.
- No comparison period. A single month's numbers in isolation are nearly meaningless. Always show trend over time, minimum the last two periods.
- Inconsistent formatting month to month. If the layout changes every time, clients can't quickly spot what's different, which defeats the purpose of regular reporting.
- Burying bad news. If a metric dropped, say so directly and explain why, with a plan. Clients trust agencies that own the dip more than ones that quietly omit the bad month.
- Sending reports with no deadline attached. If clients don't know when to expect a report, they'll ask for updates randomly, which creates extra unplanned work for you.
Building the data pipeline so reporting stops eating your week
The templates above only save time if the data behind them is easy to pull. If you're managing multiple clients across Instagram, LinkedIn, TikTok, Facebook, and a handful of other platforms, hunting through each native dashboard every month is the real time sink, not the writing.
Running your posting schedule through one platform rather than logging into each network separately means you always have a single, dated record of what went out, when, and on which account. Schedulala covers all 12 major platforms (Instagram, TikTok, Twitter/X, LinkedIn, YouTube, Facebook, Threads, Bluesky, Pinterest, Telegram, Mastodon, and Google Business Profile), which matters if your client roster spans more than the usual two or three networks and you don't want to juggle five separate scheduling tools just to keep your calendar straight.
Since Schedulala's plans count social accounts as a flat total rather than bundling specific platforms, you can set up whatever mix your client list actually needs (say, four Instagram accounts and three LinkedIn pages for different clients) without hitting an awkward per-platform cap halfway through onboarding a new account. And because scheduled posts are unlimited on every plan, agencies running high-volume content calendars for multiple clients aren't penalized for posting frequently.
None of this replaces the analysis and narrative work that makes a report useful, but it does remove the scavenger hunt that eats up the first half of your reporting time every month. Less time hunting for what posted, more time writing the sentence that explains why it mattered.
A quick checklist before you hit send
Run through this before sending any client report. It takes two minutes and catches the mistakes that make a report look rushed.
- Does the executive summary answer 'so what' in the first three sentences?
- Are the KPIs tied to the client's actual stated business goal, not just whatever was easiest to pull?
- Is there a comparison period next to every major number?
- Are the top three posts included, with a one-line reason each one worked?
- Are there specific, actionable next steps, not vague filler language?
- Does the formatting match last month's report so trends are easy to spot?
- Did you send a short note with the attachment highlighting the headline?
Final takeaway
Reporting isn't busywork you squeeze in at the end of the month, it's where clients actually see the value of what you've been doing for the last four weeks. A report built on the five-section structure above, matched to the right template for the client's needs, and backed by a consistent monthly process will do more for retention than almost any single piece of content you post.
Try Schedulala for free
Schedule posts to Bluesky, Twitter, and 8 other platforms from one dashboard.
Get started for free→
![Social Media Proposal Template [Free Download] - Win More Clients](/_next/image?url=%2Fblog%2Fsocial-media-proposal-template%2Fheader.jpeg&w=3840&q=75&dpl=dpl_6RiKV7dz1EjMEbYgqheh1pc2YPwv)