Pinterest Analytics Guide: The Metrics That Actually Matter (And the Ones You Can Ignore)
A practical Pinterest analytics guide covering the metrics that drive traffic and sales, how to read them, and which numbers to stop obsessing over.

Open Pinterest Analytics right now and you'll see a wall of numbers: impressions, engagements, saves, outbound clicks, total audience, engaged audience, and about six other metrics that all sound like they mean the same thing. Most people stare at this dashboard for thirty seconds, feel vaguely reassured or vaguely panicked, and close the tab without changing a single thing about their strategy. Learn more about YouTube scheduling.
See It in Action
This is what scheduling YouTube Shorts looks like in Schedulala
That's a waste of a genuinely useful tool. Pinterest's analytics can tell you exactly which pins are driving website traffic, which boards are dead weight, and what your audience actually searches for before they find you. You just have to know which numbers to trust and which ones to stop worrying about. Our scheduling across platforms can help.
This guide breaks down every metric in Pinterest Analytics, tells you which ones correlate with real business outcomes (traffic, sales, leads), and which ones are just noise. If you run an ecommerce shop, a blog, a service business, or you manage Pinterest for clients, this is the framework I'd actually use. See our telegram content ideas what guide.
Try Schedulala for free
Schedule posts to Bluesky, Twitter, and 8 other platforms from one dashboard.
Get started for free→Why Pinterest analytics work differently than other platforms
Before we get into individual metrics, it helps to understand what Pinterest actually is: a visual search engine, not a social network. People aren't scrolling to catch up with friends. They're searching for recipes, home renovation ideas, outfit inspiration, or a product to buy. That changes what "good" analytics look like. Our youtube shorts ideas 100 can help.
On Instagram or TikTok, a pin's, sorry, a post's performance mostly happens in the first 24 to 48 hours, then it dies. On Pinterest, a single pin can keep generating impressions and clicks for months, sometimes years, after you published it. This is called the "long tail" and it's the reason Pinterest analytics need a different reading strategy than Instagram Insights or TikTok Analytics. Our best time to post on youtube can help.
If you judge a Pinterest post the way you'd judge an Instagram Reel, checking performance three days after posting, you'll think most of your pins flopped. Some of them are just getting started. This is the single biggest mindset shift you need before any metric will actually make sense. See our youtube character counter guide.
Where to find your Pinterest analytics
You need a Pinterest business account to access analytics at all. If you're still on a personal account, converting is free and takes about two minutes, do it before reading further.
Native Pinterest Analytics
Log into Pinterest on desktop, click the analytics icon (it looks like a small graph) in the top navigation, then choose "Overview." This gives you account-level trends: impressions, engagement, and audience growth over a selected date range. From there you can drill into individual pins and boards under "Pin analytics."
Scheduling tool analytics
Native analytics are fine but limited if you're managing multiple accounts or need to report to clients. A scheduling platform that pulls Pinterest data alongside your other channels saves you from juggling five different dashboards. If you're already scheduling pins through a tool like Schedulala, you can view pin performance next to your Instagram, TikTok, and other platform data in one place instead of exporting spreadsheets from six different apps.
The metrics that actually matter
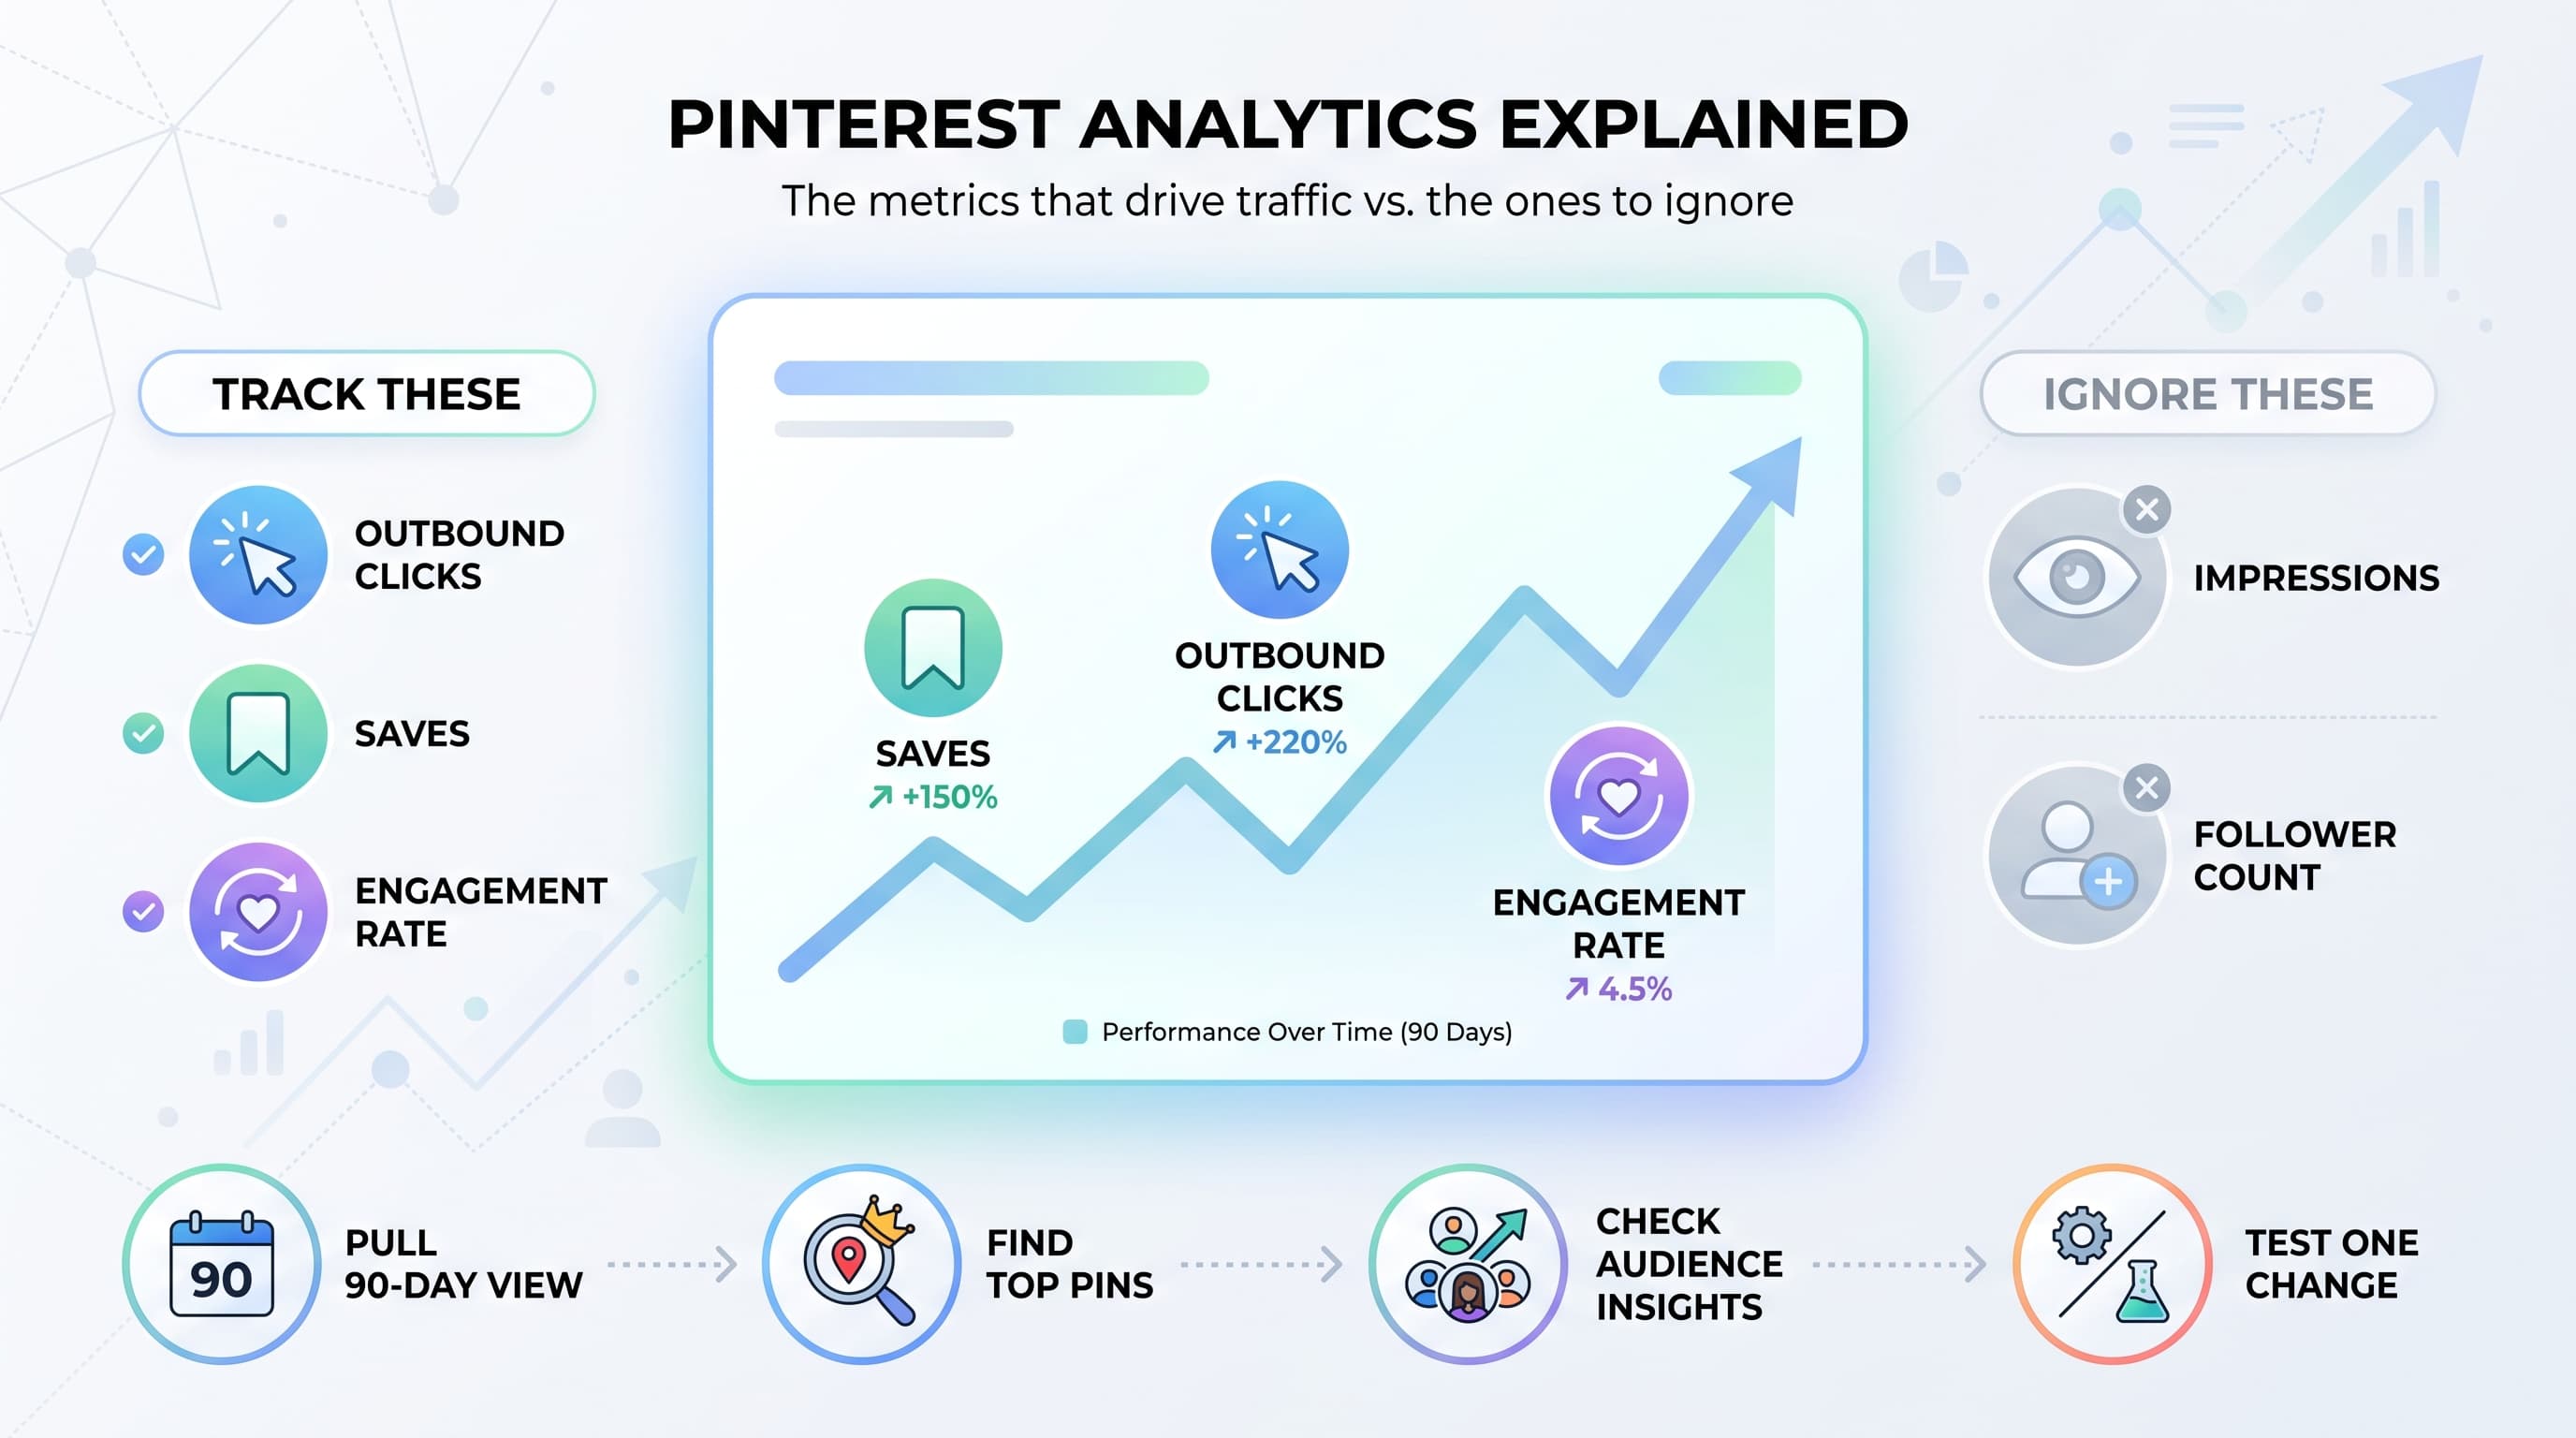
Here's the short list. If you only track five things on Pinterest, track these.
1. Outbound clicks
This is the number of times someone clicked a pin and landed on your website. If you're using Pinterest to drive traffic, sales, or leads, outbound clicks are the closest thing to a north star metric you'll find. Impressions can be huge while outbound clicks stay near zero, which tells you people are seeing your pins but not caring enough to leave Pinterest for them.
Compare outbound click rate (clicks divided by impressions) across your pins, not raw click counts. A pin with 2,000 impressions and 80 clicks (4% click rate) is outperforming a pin with 40,000 impressions and 100 clicks (0.25% click rate), even though the second pin looks bigger on paper.
2. Saves
Saves are Pinterest's version of a bookmark, and they matter more here than a "like" would on Instagram because a save is a direct signal to Pinterest's algorithm that the content is worth showing to more people. High save counts on a pin usually predict continued impression growth over the following weeks.
Saves also tell you something about content strategy specifically: people save things they intend to come back to, like recipes, tutorials, and product roundups. If your saves are consistently high but outbound clicks are low, your content is inspiring but your call to action or landing page isn't converting that interest.
3. Engagement rate
Pinterest calculates this as total engagements (saves, clicks, comments) divided by impressions. It's a useful normalized number for comparing pins of wildly different reach. A brand new account with 500 impressions per pin should compare engagement rate, not raw engagement count, against a bigger account with 50,000 impressions per pin.
Anything above 2% is solid for most niches. Home decor, food, and DIY content tends to run higher (3 to 5%) because those categories are search-heavy and visually driven. B2B or service-based content usually sits lower, and that's normal, not a failure.
4. Top pins and top boards reports
Under Analytics > Overview, Pinterest shows you your top-performing pins and boards for the selected period. This is where you find your winners and your patterns. Look for what the top five pins have in common: format (video vs. static), color scheme, headline style, or topic. Then make more of that.
Most accounts discover that 80% of their traffic comes from 10 to 15% of their pins. Once you know which pins are carrying the account, you can create fresh variations of them (new text overlay, new cover image, same landing page) instead of guessing at new topics from scratch.
5. Audience insights (interests, demographics, top locations)
Under "Audience insights," Pinterest shows you the interests, age ranges, genders, and locations of both your existing audience and, separately, your engaged audience (the people actively saving and clicking, not just seeing your content in feed).
The engaged audience data is more useful than total audience data because it tells you who's actually responding, not just who's technically following you. If your engaged audience skews toward an interest category you weren't targeting, that's a content opportunity worth testing.
6. Video metrics (if you're posting video pins)
Video pins get their own set of metrics: average watch time, video views (3-second minimum by default), and 95% completion rate. If you're investing time in video pins and completion rates are consistently under 20%, your hook (the first 1 to 2 seconds) needs work before you scale up production.
Metrics that get too much attention
Not every number in the dashboard deserves your energy. A few are borderline vanity metrics, useful for context but dangerous when treated as goals on their own.
Impressions
Impressions measure how many times a pin showed up in someone's feed or search results. High impressions feel great to screenshot, but they mean nothing without a corresponding click or save rate. Pinterest's algorithm will happily show a pin to 50,000 people who scroll right past it. Impressions tell you reach, not resonance.
Total audience
This is your follower count, essentially. Pinterest deprioritizes follower relationships compared to Instagram or TikTok, since most of your distribution comes from search and the smart feed, not from people who follow you. A brand with 3,000 followers can easily outperform one with 300,000 followers if its pins are optimized for search and its content actually converts.
Pin count / posting frequency alone
Posting more pins isn't inherently good if the pins are weak. Pinterest used to reward high-volume posting more heavily, but the platform has shifted toward rewarding quality and search relevance. Ten well-optimized pins targeting real search terms will usually outperform fifty rushed pins with generic titles.
A quick reference table
| Metric | What it tells you | Priority level |
|---|---|---|
| Outbound clicks | Traffic driven to your site | High |
| Save rate | Content resonance, algorithm signal | High |
| Engagement rate | Normalized performance across pin sizes | High |
| Top pins/boards | What's working, what to repeat | High |
| Engaged audience insights | Who actually responds to your content | Medium-High |
| Video watch time / completion | Hook and pacing quality (video only) | Medium |
| Impressions | Reach, not resonance | Low |
| Total audience/followers | Vanity metric on Pinterest | Low |
Setting up a Pinterest reporting routine
Analytics only matter if you actually look at them on a schedule and use them to change what you post. Here's a simple monthly routine that takes about 30 minutes and covers everything you need.
1. Pull a 90-day trend view
Set the date filter to the last 90 days and note the overall direction of impressions, saves, and outbound clicks. You're checking for trend, not a single day's spike or dip.
2. Identify your top 10 pins
Sort by outbound clicks, not impressions. Write down the topic, format, and headline style of each. Look for a pattern: are they all how-to content? Product roundups? Before-and-after transformations?
3. Identify your bottom 10 pins
These aren't failures to feel bad about, they're data. If a topic or format consistently underperforms across multiple pins, stop making more of it and reallocate that time to your winning formats.
4. Check engaged audience interests
Compare this month's top interests against last month's. New interest categories showing up here are early signals of content opportunities before you've even created anything for them.
5. Make one strategic change
Not five changes. One. Maybe it's doubling down on video pins, maybe it's rewriting titles to include more search keywords, maybe it's pausing a board that's underperforming. Test one variable at a time so you know what actually moved the numbers next month.
Common mistakes people make reading Pinterest analytics
- Judging pins too early. A pin published two weeks ago is basically still in its infancy. Wait at least 30 to 60 days before deciding it "didn't work."
- Chasing impressions over conversions. A viral pin with zero outbound clicks did nothing for your business except make your dashboard look busy.
- Ignoring seasonal search trends. Pinterest search volume for topics like "holiday recipes" or "summer outfits" spikes weeks or months before the actual season. If you only check your monthly report, you'll miss the window to capitalize on it.
- Not segmenting by pin type. Static pins, idea pins, and video pins perform differently. Averaging them together hides what's actually working.
- Comparing your account to a competitor's without context. A larger account with more historical pins will naturally have higher impressions. Compare rates, not raw totals.
- Forgetting to check Pinterest Trends. The Trends tool (separate from Analytics) shows what people are actively searching for right now. Pairing that with your own engaged audience data is one of the fastest ways to plan content that's likely to perform.
How Pinterest analytics fit into a bigger workflow
If Pinterest is one of several platforms you manage, checking analytics in isolation makes it hard to see the full picture. A blog post that performs well on Pinterest might also be worth repurposing into a carousel for Instagram or a short video script for TikTok. Without a central view of what's working across platforms, those connections are easy to miss.
This is where scheduling and reporting in one place pays off. Instead of exporting a CSV from Pinterest, another from Instagram, and manually building a slide deck, a tool that supports all 12 major platforms (Instagram, TikTok, Twitter/X, LinkedIn, YouTube, Facebook, Threads, Bluesky, Pinterest, Telegram, Mastodon, and Google Business Profile) lets you plan and review performance from a single calendar. Schedulala's plans all include unlimited scheduled posts, so testing a higher posting cadence on Pinterest to see how it affects your saves and outbound clicks doesn't run into an artificial post cap partway through the month.
Whether you're a solo creator managing one Pinterest account or an agency handling Pinterest for a dozen clients, the account structure matters too. Schedulala's plans (Personal at $29/month for 10 accounts, Team at $49/month for 25 accounts, and Agency at $99/month for 100 accounts) let you mix and match accounts across platforms however your business actually needs, instead of being boxed into fixed "channel sets" that force you to pay for platforms you don't use.
Try Schedulala for free
Schedule posts to Bluesky, Twitter, and 8 other platforms from one dashboard.
Get started for free→Building a simple monthly Pinterest report
If you report to a boss, a client, or just future-you, keep the report short and focused on what changed and why. A one-page format works better than a 15-tab spreadsheet nobody reads.
- Total outbound clicks this month vs. last month (with percentage change)
- Top 5 pins by outbound clicks, with the topic and format noted
- Save rate trend over the last 90 days
- Top 3 engaged audience interests and whether they shifted
- One thing you changed this month and what happened as a result
- One thing you're testing next month
That last section, the ongoing test, is the part most reports skip. Without a documented hypothesis ("we're testing longer titles with the primary keyword in the first five words"), you end up rediscovering the same insights every few months instead of building on them.
Final takeaway
Pinterest analytics reward patience and pattern recognition more than daily obsessing. Check outbound clicks and save rate as your primary signals, use the top pins report to find what to repeat, and give every pin at least a month before judging it. Ignore raw impressions and follower counts unless you're specifically running a brand awareness campaign, they rarely correlate with the traffic or sales most accounts are actually chasing.
Try Schedulala for free
Schedule posts to Bluesky, Twitter, and 8 other platforms from one dashboard.
Get started for free→