YouTube Shorts Analytics: The Complete Guide to Metrics That Actually Matter
Master YouTube Shorts analytics with this guide to the metrics that drive growth. Learn which numbers to track and which to ignore.
Quick answer
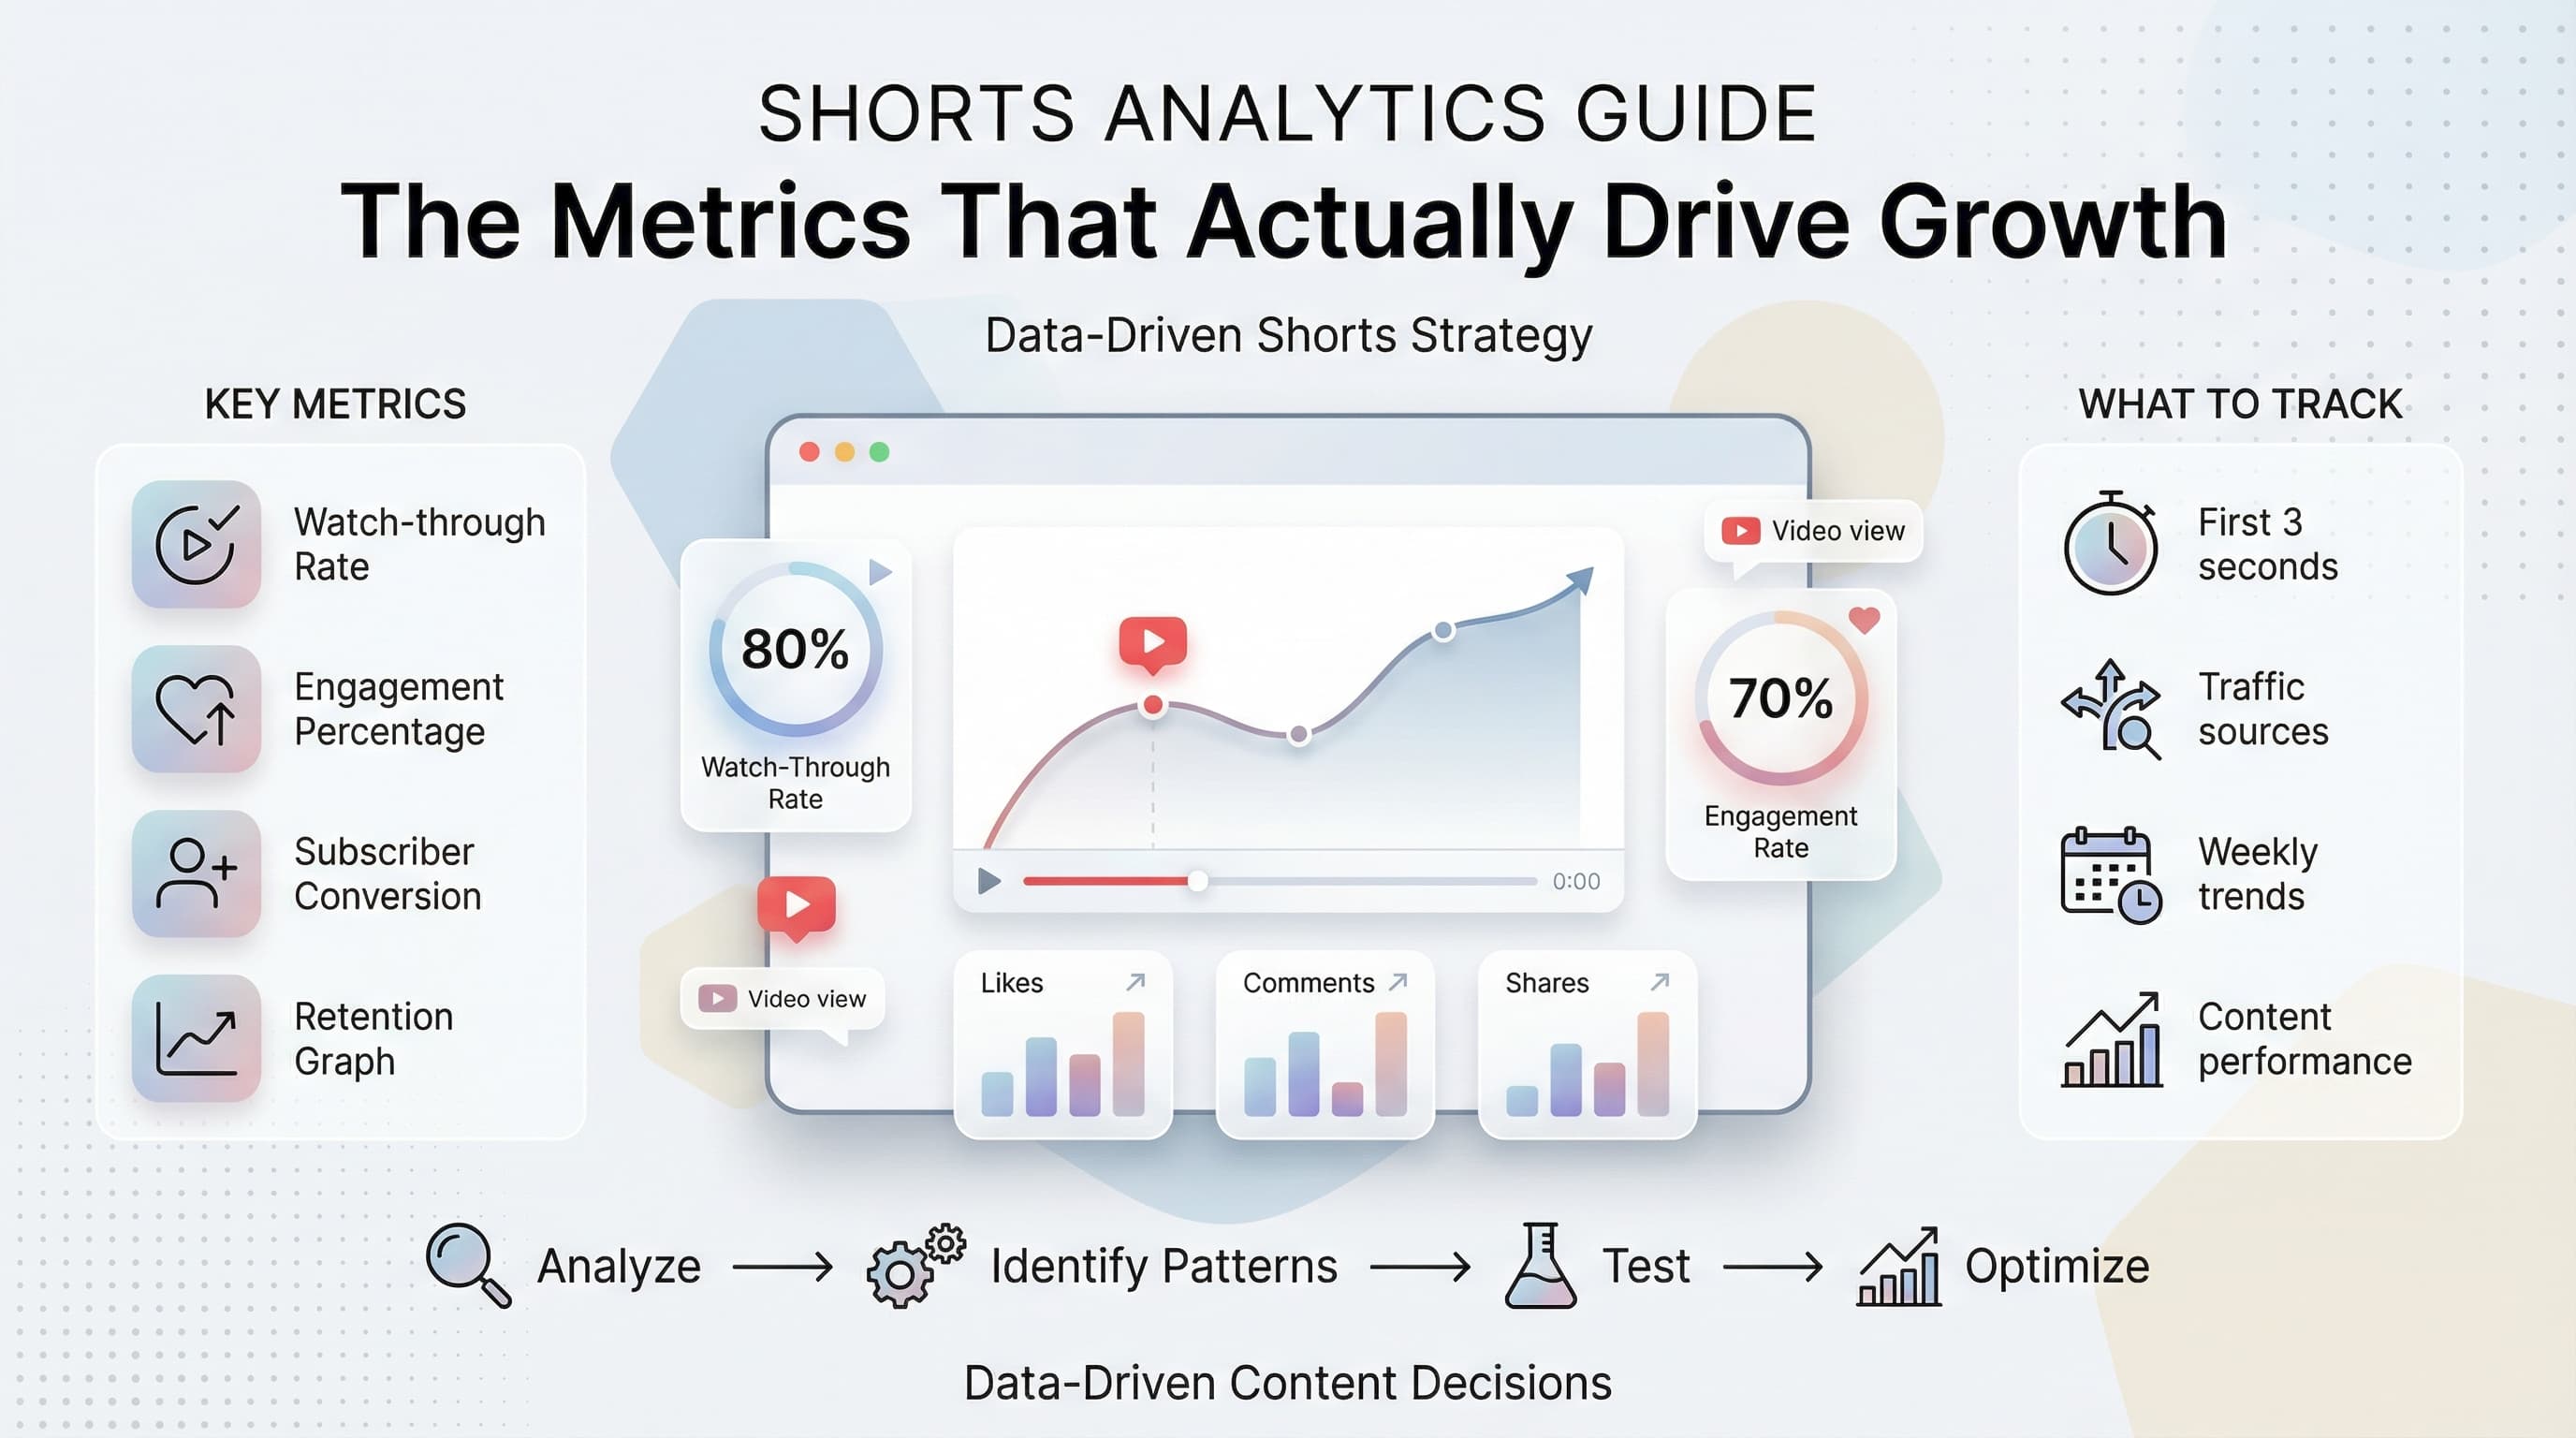
The YouTube Shorts metrics that matter most are average view duration, swipe-away rate, and views from the Shorts feed versus search.
- •Average view duration shows how long viewers watch before swiping away
- •Swipe-away rate below 30% in the first 3 seconds indicates a strong hook
- •Track views by source: Shorts feed, search, and external to understand distribution
- •YouTube Studio analytics are free; Schedulala's Team plan ($18/month) adds cross-platform tracking
Your YouTube Short just hit 50,000 views. Time to celebrate, right? Maybe. Or maybe those views came from people who watched for half a second and scrolled away. The view count alone tells you almost nothing about whether your content actually worked. Try our YouTube scheduling.
YouTube Shorts analytics can feel like drinking from a fire hose. Numbers everywhere, graphs going up and down, percentages that seem important but might not be. Most creators either obsess over the wrong metrics or ignore analytics entirely. Both approaches lead to the same place: slow growth and wasted effort. Try our scheduling across platforms.
What if you could look at your analytics dashboard and know exactly what to do next? That's what this guide delivers. We'll cut through the noise and focus on the metrics that actually predict success, show you how to interpret them correctly, and give you a framework for making data-driven decisions about your Shorts strategy. See our batch content creation guide.
Try Schedulala for free
Schedule posts to Bluesky, Twitter, and 8 other platforms from one dashboard.
Get started for free→See It in Action
This is what scheduling YouTube Shorts looks like in Schedulala
Why Shorts analytics work differently than regular YouTube
Before we dive into specific metrics, you need to understand something fundamental: Shorts play by different rules than long-form YouTube content. The algorithm evaluates them differently, viewers interact with them differently, and the metrics that matter shift accordingly. See our youtube shorts ideas 100 guide.
The fundamental difference
Traditional YouTube videos live or die by watch time. A 10-minute video that keeps viewers engaged for 7 minutes is a success. The algorithm rewards it with more impressions, and the creator can monetize those minutes with ads. Try our best time to post on youtube.
Shorts don't work this way. When your video is 30 seconds long, watch time becomes almost meaningless as a raw number. What matters is the percentage of your video people watch and whether they take action afterward. A Short that gets watched to 90% completion and drives a subscribe is worth far more than one that gets 10x the views but loses viewers after 3 seconds. Our youtube line break generator can help.
This shift changes everything about how you should read your analytics. Metrics that would concern you on a long video might be perfectly fine on a Short. Metrics that seem modest might actually indicate serious problems.
How the Shorts algorithm evaluates content
YouTube has never published exact details about how the Shorts algorithm works, but patterns emerge from creator data and YouTube's own hints. The algorithm appears to weight these factors heavily:
- Swipe-away rate (how quickly people leave)
- Watch-through rate (percentage of video completed)
- Engagement actions (likes, comments, shares)
- Subscriber conversion (new subs from the Short)
- Return viewership (do people watch more of your content?)
Notice what's not on this list? Raw view count. Views are an output of these metrics, not an input. If your Short performs well on the factors above, views follow naturally. Chasing views directly without improving these underlying metrics is like trying to lose weight by moving the scale.
The metrics that actually predict success
Let's get specific. Here are the metrics you should check every time you publish a Short, ranked by how much they actually tell you about content performance.
Watch-through rate (the king of Shorts metrics)
This is the single most important metric for YouTube Shorts. Watch-through rate tells you what percentage of viewers watched your entire video. YouTube Studio shows this as "Percentage viewed" in your analytics.
For Shorts, you want to see numbers above 70%. A Short with 80% or higher watch-through rate is performing exceptionally well. Below 50% signals a serious problem with either your hook, your content, or both.
Here's why this metric matters so much: the Shorts algorithm wants to show people content they'll enjoy. When someone watches your entire video, that's the clearest signal that they enjoyed it. High watch-through rates lead to more impressions, which leads to more views, which leads to more subscribers.
Check this metric on every Short you publish. Look for patterns. Do your talking-head Shorts get higher watch-through than your text-on-screen Shorts? Do tutorials outperform entertainment content? The answers guide your content strategy.
Average view duration vs. video length
Related to watch-through rate but with an important distinction: average view duration shows the absolute time people spent watching. For a 30-second Short, an average view duration of 24 seconds is excellent. For a 60-second Short, 24 seconds is concerning.
Always evaluate average view duration relative to your video length. The math matters here. A 45-second Short with 30-second average duration (67% retention) is performing worse than a 20-second Short with 16-second average duration (80% retention), even though the absolute number is higher.
This metric helps you make decisions about video length. If you consistently see drop-offs around the 25-second mark regardless of total length, that suggests your Shorts should be around 20-25 seconds. If retention stays strong through 50 seconds, you have room to make longer content.
Swipe-away rate (the silent killer)
This is the percentage of viewers who swiped away from your Short within the first few seconds. YouTube doesn't show this directly, but you can infer it from your audience retention graph. If the graph drops sharply in the first 1-3 seconds, your swipe-away rate is high.
A high swipe-away rate kills Shorts before they have a chance. The algorithm interprets early swipes as a signal that your content doesn't match what viewers want. It responds by showing your Short to fewer people.
The first second of your Short is the most valuable second. That's when viewers decide whether to keep watching or swipe. If you're losing 40% of viewers in the first two seconds, no amount of great content afterward will save you. Fix your hooks first.
Engagement rate (likes, comments, shares relative to views)
Raw like counts mean little without context. A Short with 500 likes might be great or terrible depending on whether it has 5,000 views or 500,000 views. Engagement rate normalizes this by showing engagement as a percentage of views.
For Shorts, aim for a like rate above 4%. Comments are harder to benchmark because they vary wildly by niche, but any comment rate above 0.5% is solid. Shares are gold because they bring new viewers directly.
Calculate your engagement rate manually by dividing total engagements by total views. A Short with 10,000 views, 500 likes, 50 comments, and 20 shares has an engagement rate of about 5.7%. That's healthy. A Short with 100,000 views and the same engagement numbers is underperforming at 0.57%.
Subscriber conversion rate
This is the percentage of viewers who subscribe after watching your Short. Find it in YouTube Studio under "Subscribers" for each video. For Shorts, good subscriber conversion rates range from 0.1% to 0.5%. Above 0.5% is exceptional.
These percentages sound tiny, but they add up. A Short that gets 100,000 views with 0.3% subscriber conversion brings 300 new subscribers. Multiply that across 50 Shorts and you've grown by 15,000 subscribers from Shorts alone.
Subscriber conversion tells you whether your Shorts attract the right audience. High views but low subscriber conversion suggests your content appeals to casual viewers who don't want more. Low views but high subscriber conversion suggests your content strongly resonates with a specific audience, and the algorithm just hasn't found them all yet.
| Metric | Good Range | Excellent Range | Red Flag |
|---|---|---|---|
| Watch-through rate | 60-70% | Above 80% | Below 50% |
| Like rate | 3-5% | Above 6% | Below 2% |
| Comment rate | 0.3-0.5% | Above 1% | Below 0.1% |
| Subscriber conversion | 0.1-0.3% | Above 0.5% | Below 0.05% |
| First-second retention | 70-80% | Above 85% | Below 60% |
Metrics that matter less than you think
Part of becoming analytically sophisticated is knowing what to ignore. These metrics get a lot of attention but provide less actionable insight than creators assume.
Raw view count
Views feel important. They're the number everyone asks about. But views alone tell you almost nothing about content quality or channel health.
A Short can go viral for all the wrong reasons: controversy, accidental exposure to the wrong audience, or algorithmic flukes that don't repeat. Meanwhile, a Short with modest views might be building exactly the audience you want.
Use view count to understand reach, not quality. Two Shorts with identical view counts can have completely different value to your channel. One might bring engaged subscribers; the other might bring people who'll never watch another video.
Impressions
Impressions count how many times your thumbnail and title appeared on someone's screen. High impressions with low views means your content didn't convince people to click. Low impressions with high views relative to impressions means your content performs well but the algorithm isn't showing it widely yet.
For Shorts specifically, impressions matter less because the feed auto-plays content. People don't "click" on Shorts the way they click on regular videos. The initial impression is the video itself, not a thumbnail.
Watch impressions as a secondary metric to understand reach, but don't optimize for impressions directly. Focus on watch-through rate and engagement; impressions follow.
Total watch time
Total watch time is the backbone of long-form YouTube success. For Shorts, it's nearly meaningless. A 30-second Short that gets watched completely 10,000 times accumulates about 83 hours of watch time. That same watch time from a 10-minute video would represent only 500 complete views.
The numbers don't compare, and YouTube knows this. They evaluate Shorts and long-form content separately. Don't stress about Shorts "hurting" your watch time metrics or try to make Shorts longer just to accumulate more minutes.
How to analyze your audience retention graph
The audience retention graph is the most information-dense tool in YouTube Studio. For Shorts, it tells a complete story about how viewers experience your content. Learning to read it properly transforms how you create.
The first three seconds
Look at the very beginning of your retention graph. If it drops sharply in the first 1-3 seconds, your hook is failing. This is the swipe-away zone, and it's where most Shorts die.
A healthy retention graph starts at 100% and drops gradually to around 80-90% in the first three seconds. If you're dropping to 60% or below, your opening frames aren't compelling enough. Viewers are deciding you're not worth their time before you've even started.
Fix this by front-loading your most interesting visual or statement. Don't "build up" to the good stuff. Start with it. The first frame should make viewers want to see the second frame.
The middle section
After the initial drop, a good retention graph levels out and declines gradually. Small bumps up or down are normal. What you're looking for is steep drops, which indicate moments where you lost significant viewers.
When you see a steep drop, note exactly where it happens in your video. Then watch that section. What changed? Did the pacing slow? Did you introduce a confusing element? Did the visual interest decrease? The drop tells you something went wrong; your job is to figure out what.
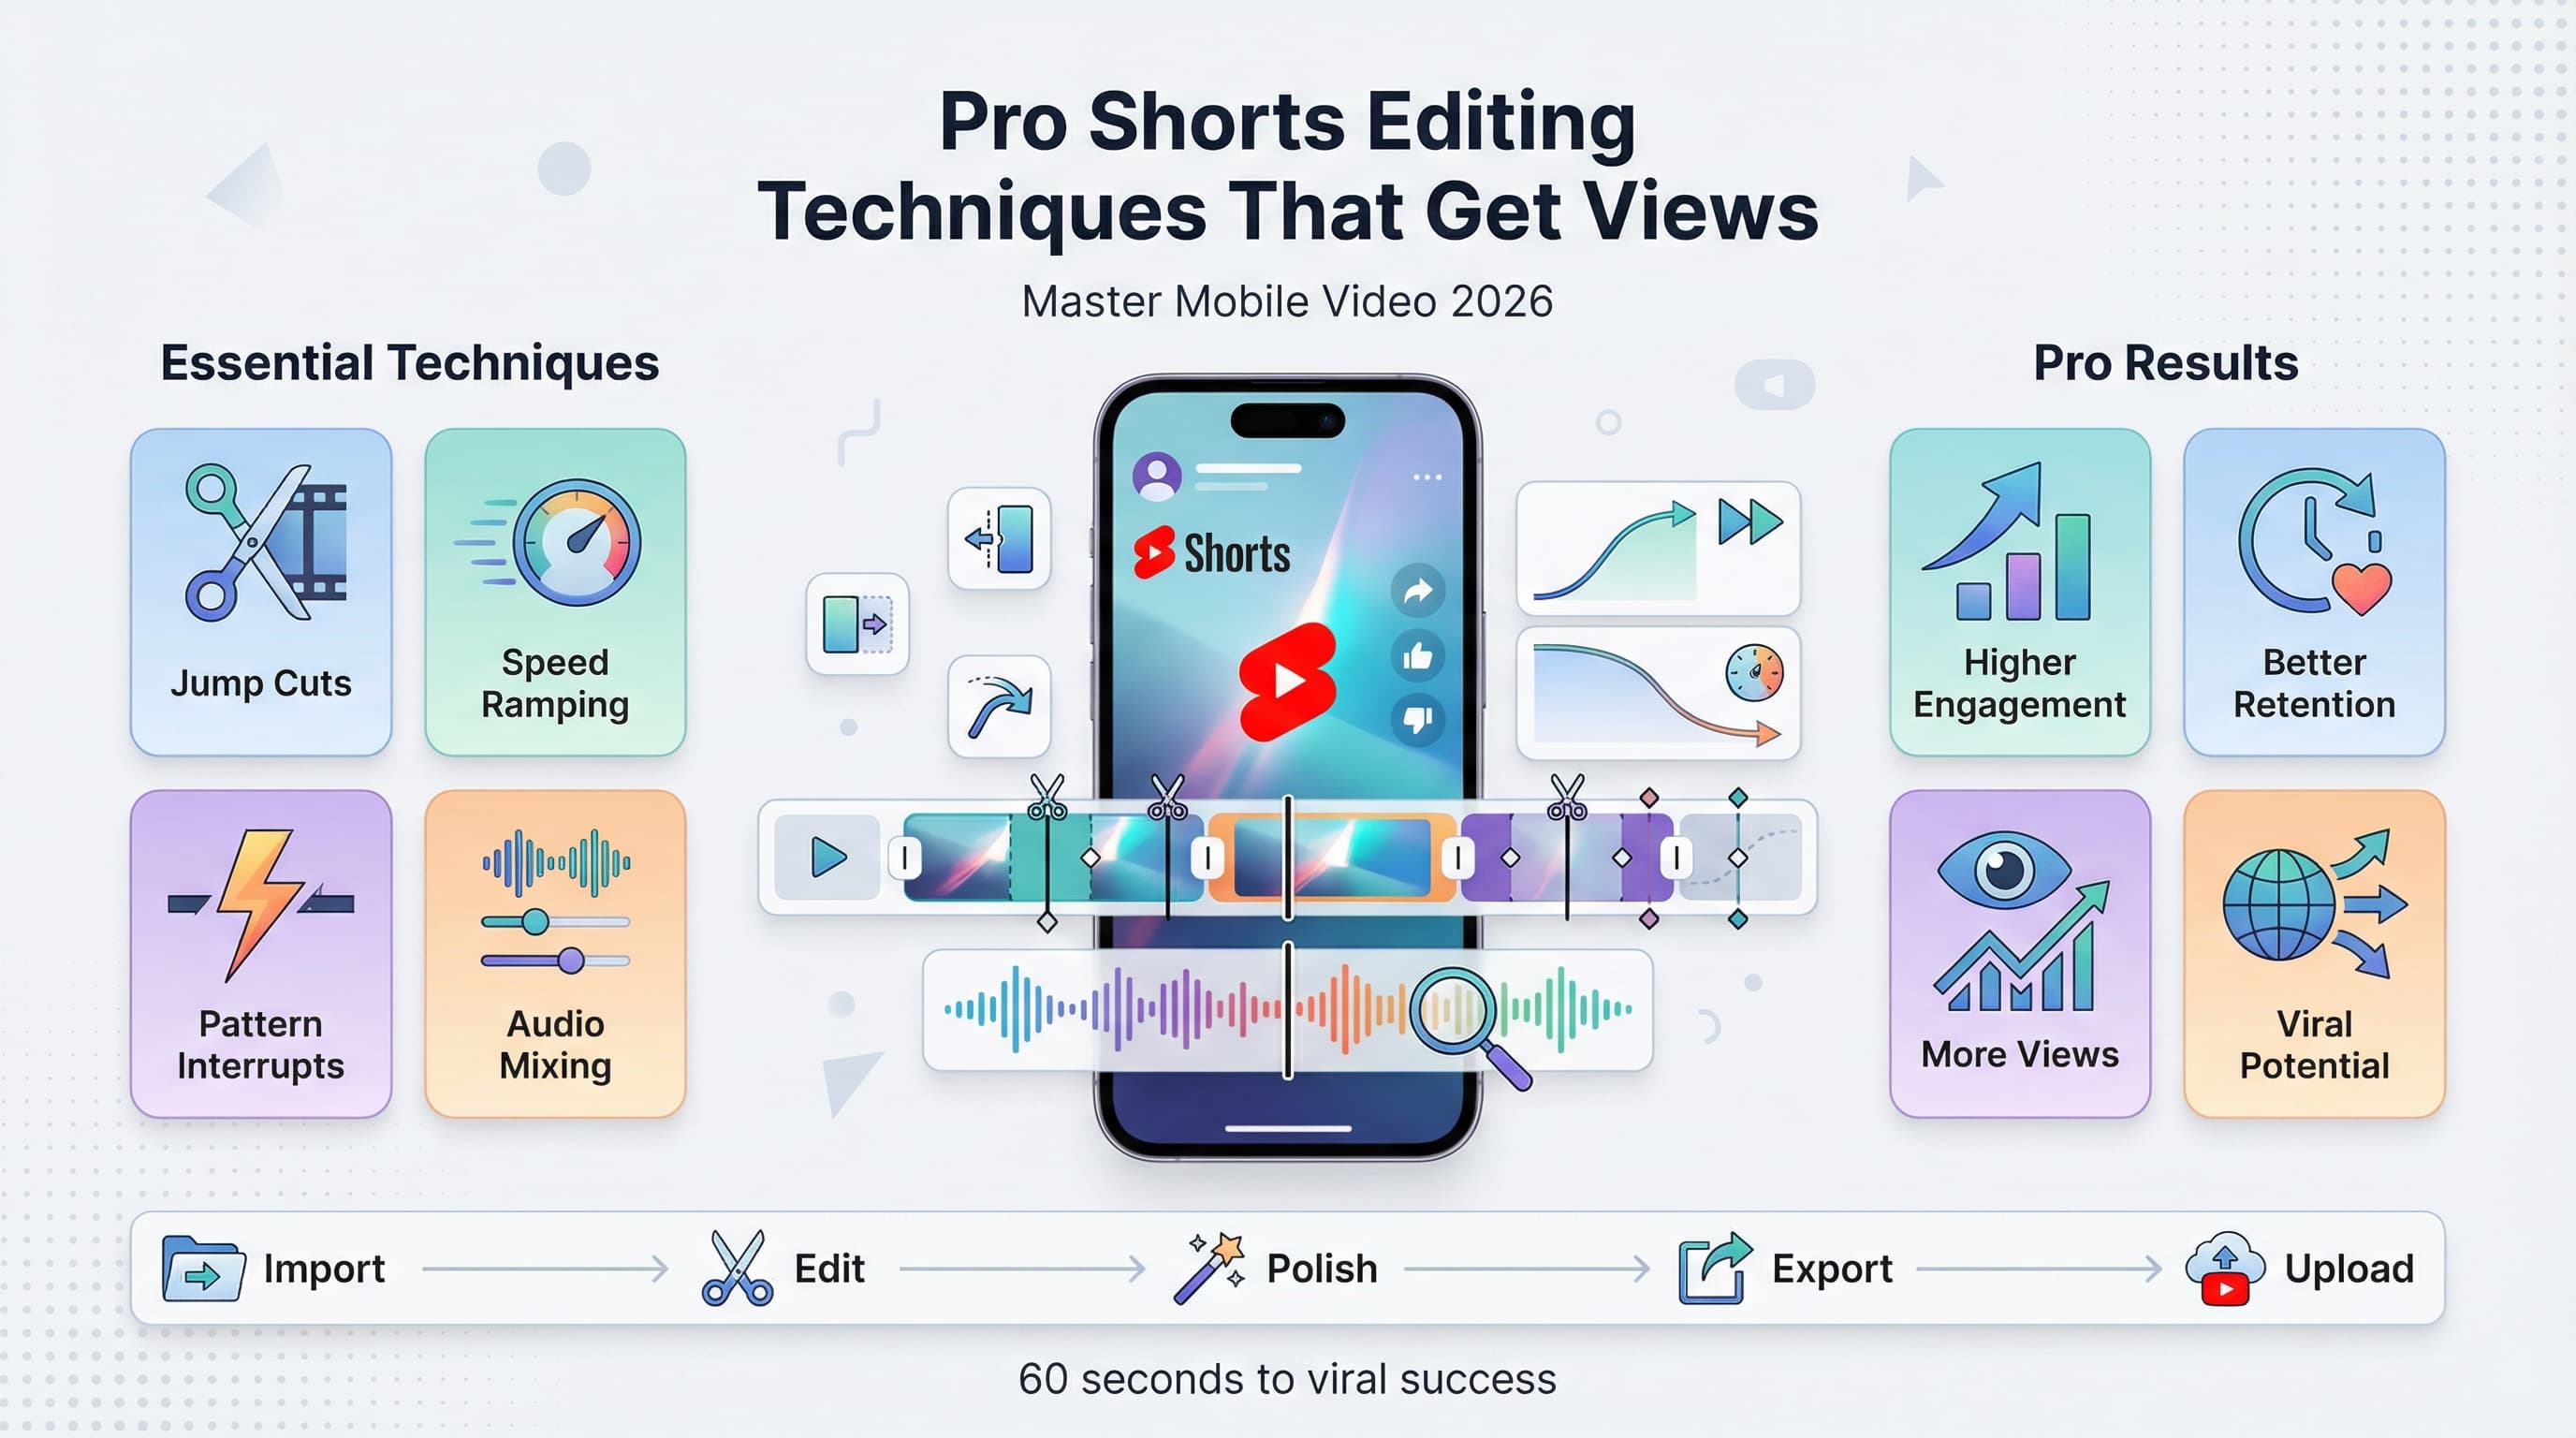
Look for patterns across multiple Shorts. If you consistently see drops around the 15-second mark, something about your middle sections isn't working. Maybe you need to add a "pattern interrupt" to re-engage viewers. Maybe your Shorts should be shorter. The pattern tells you where to experiment.
The ending
How your retention graph behaves in the final seconds reveals whether viewers found your content satisfying. A graph that holds steady or even ticks up at the end suggests viewers wanted to see how it concluded. A graph that drops off sharply at the end suggests viewers felt they got the point and didn't need to stay.
For Shorts, you want viewers watching to the very last second. That signals to the algorithm that your content delivered value throughout. If you're losing viewers in the final 5 seconds consistently, consider cutting your endings tighter or adding a final hook that rewards viewers who stay.
Traffic sources and what they tell you
Where your views come from matters almost as much as how many you get. Traffic sources reveal whether your Shorts are being discovered organically or just shown to existing subscribers.
Shorts feed traffic
This is the main discovery engine for Shorts. When someone scrolls through the Shorts feed and watches your video, it counts as Shorts feed traffic. High percentage from this source means the algorithm is actively distributing your content to new viewers.
Most successful Shorts get 70-90% of their traffic from the Shorts feed. If you're below 50%, your Shorts might be reaching existing subscribers but failing to break out to new audiences. This isn't necessarily bad if you're using Shorts to engage your existing community, but it limits growth potential.
When a Short suddenly gets a surge of Shorts feed traffic, it means the algorithm decided to push it harder. Watch for these moments and analyze what made that particular Short work. Then make more content like it.
Channel page and subscriber home
Traffic from these sources comes from people who already know your channel. They saw your Short because they visited your page or because it appeared in their subscriber feed.
High traffic from these sources early in a Short's life is normal. Your subscribers see it first. What matters is whether Shorts feed traffic picks up afterward. If a Short only ever gets channel page traffic, it never broke through to broader discovery.
Some creators use early subscriber engagement to "seed" the algorithm. The theory is that strong early engagement from subscribers signals to YouTube that the content is good, prompting broader distribution. The data on this is mixed, but consistent early engagement doesn't hurt.
External traffic
Traffic from outside YouTube, such as social media links, embedded Shorts, or direct URL shares, appears as external traffic. For most Shorts, this is a small percentage. If it's large, someone is actively sharing your content externally, which is a strong signal.
You can drive external traffic yourself by sharing Shorts on other platforms. This doesn't directly boost algorithmic distribution, but it can increase total engagement metrics, which might help indirectly. More importantly, it expands your reach beyond YouTube's walls.
| Traffic Source | Typical Range | What It Means |
|---|---|---|
| Shorts feed | 60-90% | Algorithm is distributing your content |
| Channel page | 5-20% | Existing viewers finding your content |
| Subscriber home | 5-15% | Your subscribers are seeing your Shorts |
| External | 1-10% | Content is being shared outside YouTube |
| Search | 1-5% | People are searching for your topic |
Building a weekly analytics review process
Analytics are useless if you don't act on them. Here's a practical framework for reviewing your Shorts performance and making informed decisions about future content.
Step 1: Identify your top and bottom performers
Each week, sort your Shorts by views or watch time. Identify your top 3 performers and your bottom 3 performers. Don't just celebrate the wins; study them. What made the top performers work? What made the bottom performers fail?
Look beyond surface-level explanations. "It was trending" or "the algorithm didn't pick it up" aren't useful insights. Go deeper. What was different about the hook? The pacing? The topic? The time you posted?
Document your findings. Keep a simple spreadsheet or note with observations about each Short. Over time, patterns emerge that are impossible to see in individual videos.
Step 2: Compare retention graphs
Pull up the retention graphs for your top and bottom performers side by side. Where do they differ? Your best Shorts probably maintain stronger early retention and avoid sharp mid-video drops. Your worst Shorts probably have specific moments where viewers abandoned ship.
Note the exact timestamps where problems occur in underperforming Shorts. Then watch those moments. Train yourself to spot the issues that cause viewers to leave. Eventually, you'll start catching them during editing before you even publish.
Step 3: Check subscriber conversion trends
Are your Shorts bringing in new subscribers? Look at your subscriber growth over the week and attribute it to specific Shorts where possible. If your views are growing but subscriber conversion is flat or declining, your content might be reaching the wrong audience or failing to convince viewers to commit.
Compare subscriber conversion rates across different content types. Maybe your tutorial Shorts convert subscribers at 0.4% while your entertainment Shorts convert at 0.1%. That's valuable information for deciding where to focus your energy.
Step 4: Plan experiments based on data
Every analytics review should end with at least one hypothesis to test. "My Shorts with questions in the first second have better retention, so I'll try adding questions to more Shorts." "My 45-second Shorts outperform my 60-second Shorts, so I'll aim for tighter edits."
Run these experiments deliberately. Don't change five things at once. Change one variable, publish a few Shorts, measure the results, then move to the next experiment. Systematic testing beats random guessing.
Common analytics mistakes to avoid
Even creators who check their analytics regularly often misinterpret what they see. Here are the most common mistakes and how to avoid them.
Comparing yourself to viral outliers
Seeing a Short with 10 million views and comparing it to your 5,000-view Shorts is demoralizing and useless. Viral hits involve luck, timing, and factors beyond any creator's control. They're not a realistic benchmark.
Compare yourself to yourself. Is this week better than last week? Is your average retention improving? Are you converting subscribers more efficiently? Your own progress is the only meaningful metric.
Overreacting to single data points
One Short flopping doesn't mean your strategy is broken. One Short going viral doesn't mean you've figured everything out. Individual Shorts have variance. Look for patterns across 10, 20, 50 Shorts before making major strategy changes.
This is hard when emotions are involved. A Short you worked hard on performs badly, and you want to blame something and change direction. Resist that urge. Collect more data first.
Ignoring qualitative feedback
Analytics tell you what happened, not why. Comments tell you why. A Short might have great retention but comments that say "this was confusing" or "not what I expected." Those comments reveal problems that numbers alone can't surface.
Read your comments, especially negative ones. They're free feedback from your actual audience. Sometimes a single comment contains more actionable insight than hours of staring at graphs.
Chasing trends without considering fit
You see a trending topic generating millions of views. You make a Short about it. It flops. What went wrong? Probably the topic didn't fit your audience or your expertise, so even though the topic was popular, your version didn't resonate.
Trends can work, but only if they align with what your audience expects from you. A cooking channel jumping on a tech trend might get views but won't convert subscribers. Worse, it might confuse the algorithm about who your audience is.
Neglecting the relationship between Shorts and long-form
If you also make long-form content, track whether your Shorts viewers become long-form viewers. A Short that drives traffic to your longer videos is more valuable than one that doesn't, even if it has fewer views.
Check "other videos your viewers watched" to see if your own long-form content appears. If viewers are watching your Shorts but ignoring your longer videos, the content might not be well-aligned, or you might need to create better bridges between the two.
Using analytics to optimize your posting schedule
When you post matters, though maybe not as much as some gurus claim. Analytics can help you find your optimal posting times and frequency.
Finding when your audience is online
In YouTube Studio, the "When your viewers are on YouTube" report shows hourly and daily patterns for your specific audience. Posting when more of your viewers are online increases the chance of early engagement, which can help the algorithm pick up your Short.
That said, the Shorts feed is global and runs 24/7. Your Short might blow up at 3 AM because it reaches viewers in other time zones. Use the viewer data as a starting point, not a rigid rule.
Testing different posting frequencies
Some creators post one Short per day. Others post three. Some post weekly. There's no universal right answer. The right frequency depends on your capacity to maintain quality and your audience's appetite for content.
Test by varying your frequency and watching the metrics. If you double your posting rate but average watch-through drops significantly, you're sacrificing quality for quantity. If you post less but metrics stay strong, maybe you've found a sustainable pace.
Managing multiple Shorts and finding optimal timing becomes much easier with a scheduling tool. When you can batch create and schedule posts in advance, you're free to focus on the creative work rather than the logistics of publishing.
Advanced analytics strategies for serious growth
Once you've mastered the basics, these advanced approaches can give you an edge.
A/B testing with similar content
Create two versions of similar content with one variable changed. Different hooks, different lengths, different formats. Publish them and compare performance. This is slower than traditional A/B testing but provides real-world data about what works for your specific audience.
Document everything. Over months of testing, you'll build a playbook of proven techniques specific to your channel. That's invaluable and can't be copied from generic advice.
Tracking content pillars separately
If you make different types of content (tutorials, behind the scenes, quick tips, entertainment), track the metrics for each type separately. One content pillar might drive views while another drives subscribers. Both are valuable, but knowing which does what helps you balance your content mix.
Create a simple tagging system in a spreadsheet. For each Short, note the content type, then aggregate metrics by type. After a few months, you'll see clear patterns about which types of content serve which goals.
Cohort analysis for subscriber quality
Not all subscribers are equal. Someone who subscribed after watching 10 of your Shorts is more likely to engage with future content than someone who subscribed after watching one. While YouTube doesn't provide direct cohort data, you can approximate it by tracking engagement rates over time.
If your subscriber count is growing but your engagement rate per Short is declining, you might be accumulating low-quality subscribers who don't actually watch. This can happen with viral Shorts that reach outside your target audience. It's not necessarily bad, but it's worth understanding.
Competitive benchmarking
You can't see other creators' detailed analytics, but you can see their public metrics: views, likes, comments. Track 5-10 creators in your niche. Note their posting frequency, typical engagement rates, and which topics perform best for them.
This isn't about copying. It's about understanding the landscape. If every creator in your niche sees low engagement on a certain topic, that's useful information. If one creator consistently outperforms, study what makes their content different.
Turning analytics into action: your weekly checklist
Here's a practical checklist you can use every week to turn analytics insights into better content.
Monday: Review last week's performance
- Identify top 3 and bottom 3 Shorts by views
- Note watch-through rates for each
- Compare retention graphs
- Record subscriber conversions
- Document one insight or hypothesis
Wednesday: Mid-week check-in
- Check how this week's Shorts are performing
- Look for early signals of winners or losers
- Adjust upcoming content if needed
- Respond to comments for engagement boost
Friday: Plan next week
- Decide on content topics based on what's working
- Plan at least one experiment to test a hypothesis
- Schedule or batch create Shorts for the week
- Set specific goals for metrics you want to improve
The bottom line on YouTube Shorts analytics
YouTube Shorts analytics aren't complicated once you know what to focus on. Watch-through rate is your north star. Engagement rate tells you if content resonates. Subscriber conversion tells you if you're building an audience or just entertaining passersby. Traffic sources tell you if the algorithm is working for you.
Everything else is either a lagging indicator or noise. Views follow quality. Impressions follow engagement. Watch time is irrelevant for short-form content. Stop chasing vanity metrics and start optimizing the numbers that actually drive growth.
The creators who win on YouTube Shorts aren't the ones who check analytics obsessively. They're the ones who check analytics strategically, extract actionable insights, and then focus their energy on making better content. Analytics inform creativity; they don't replace it.
Try Schedulala for free
Schedule posts to Bluesky, Twitter, and 8 other platforms from one dashboard.
Get started for free→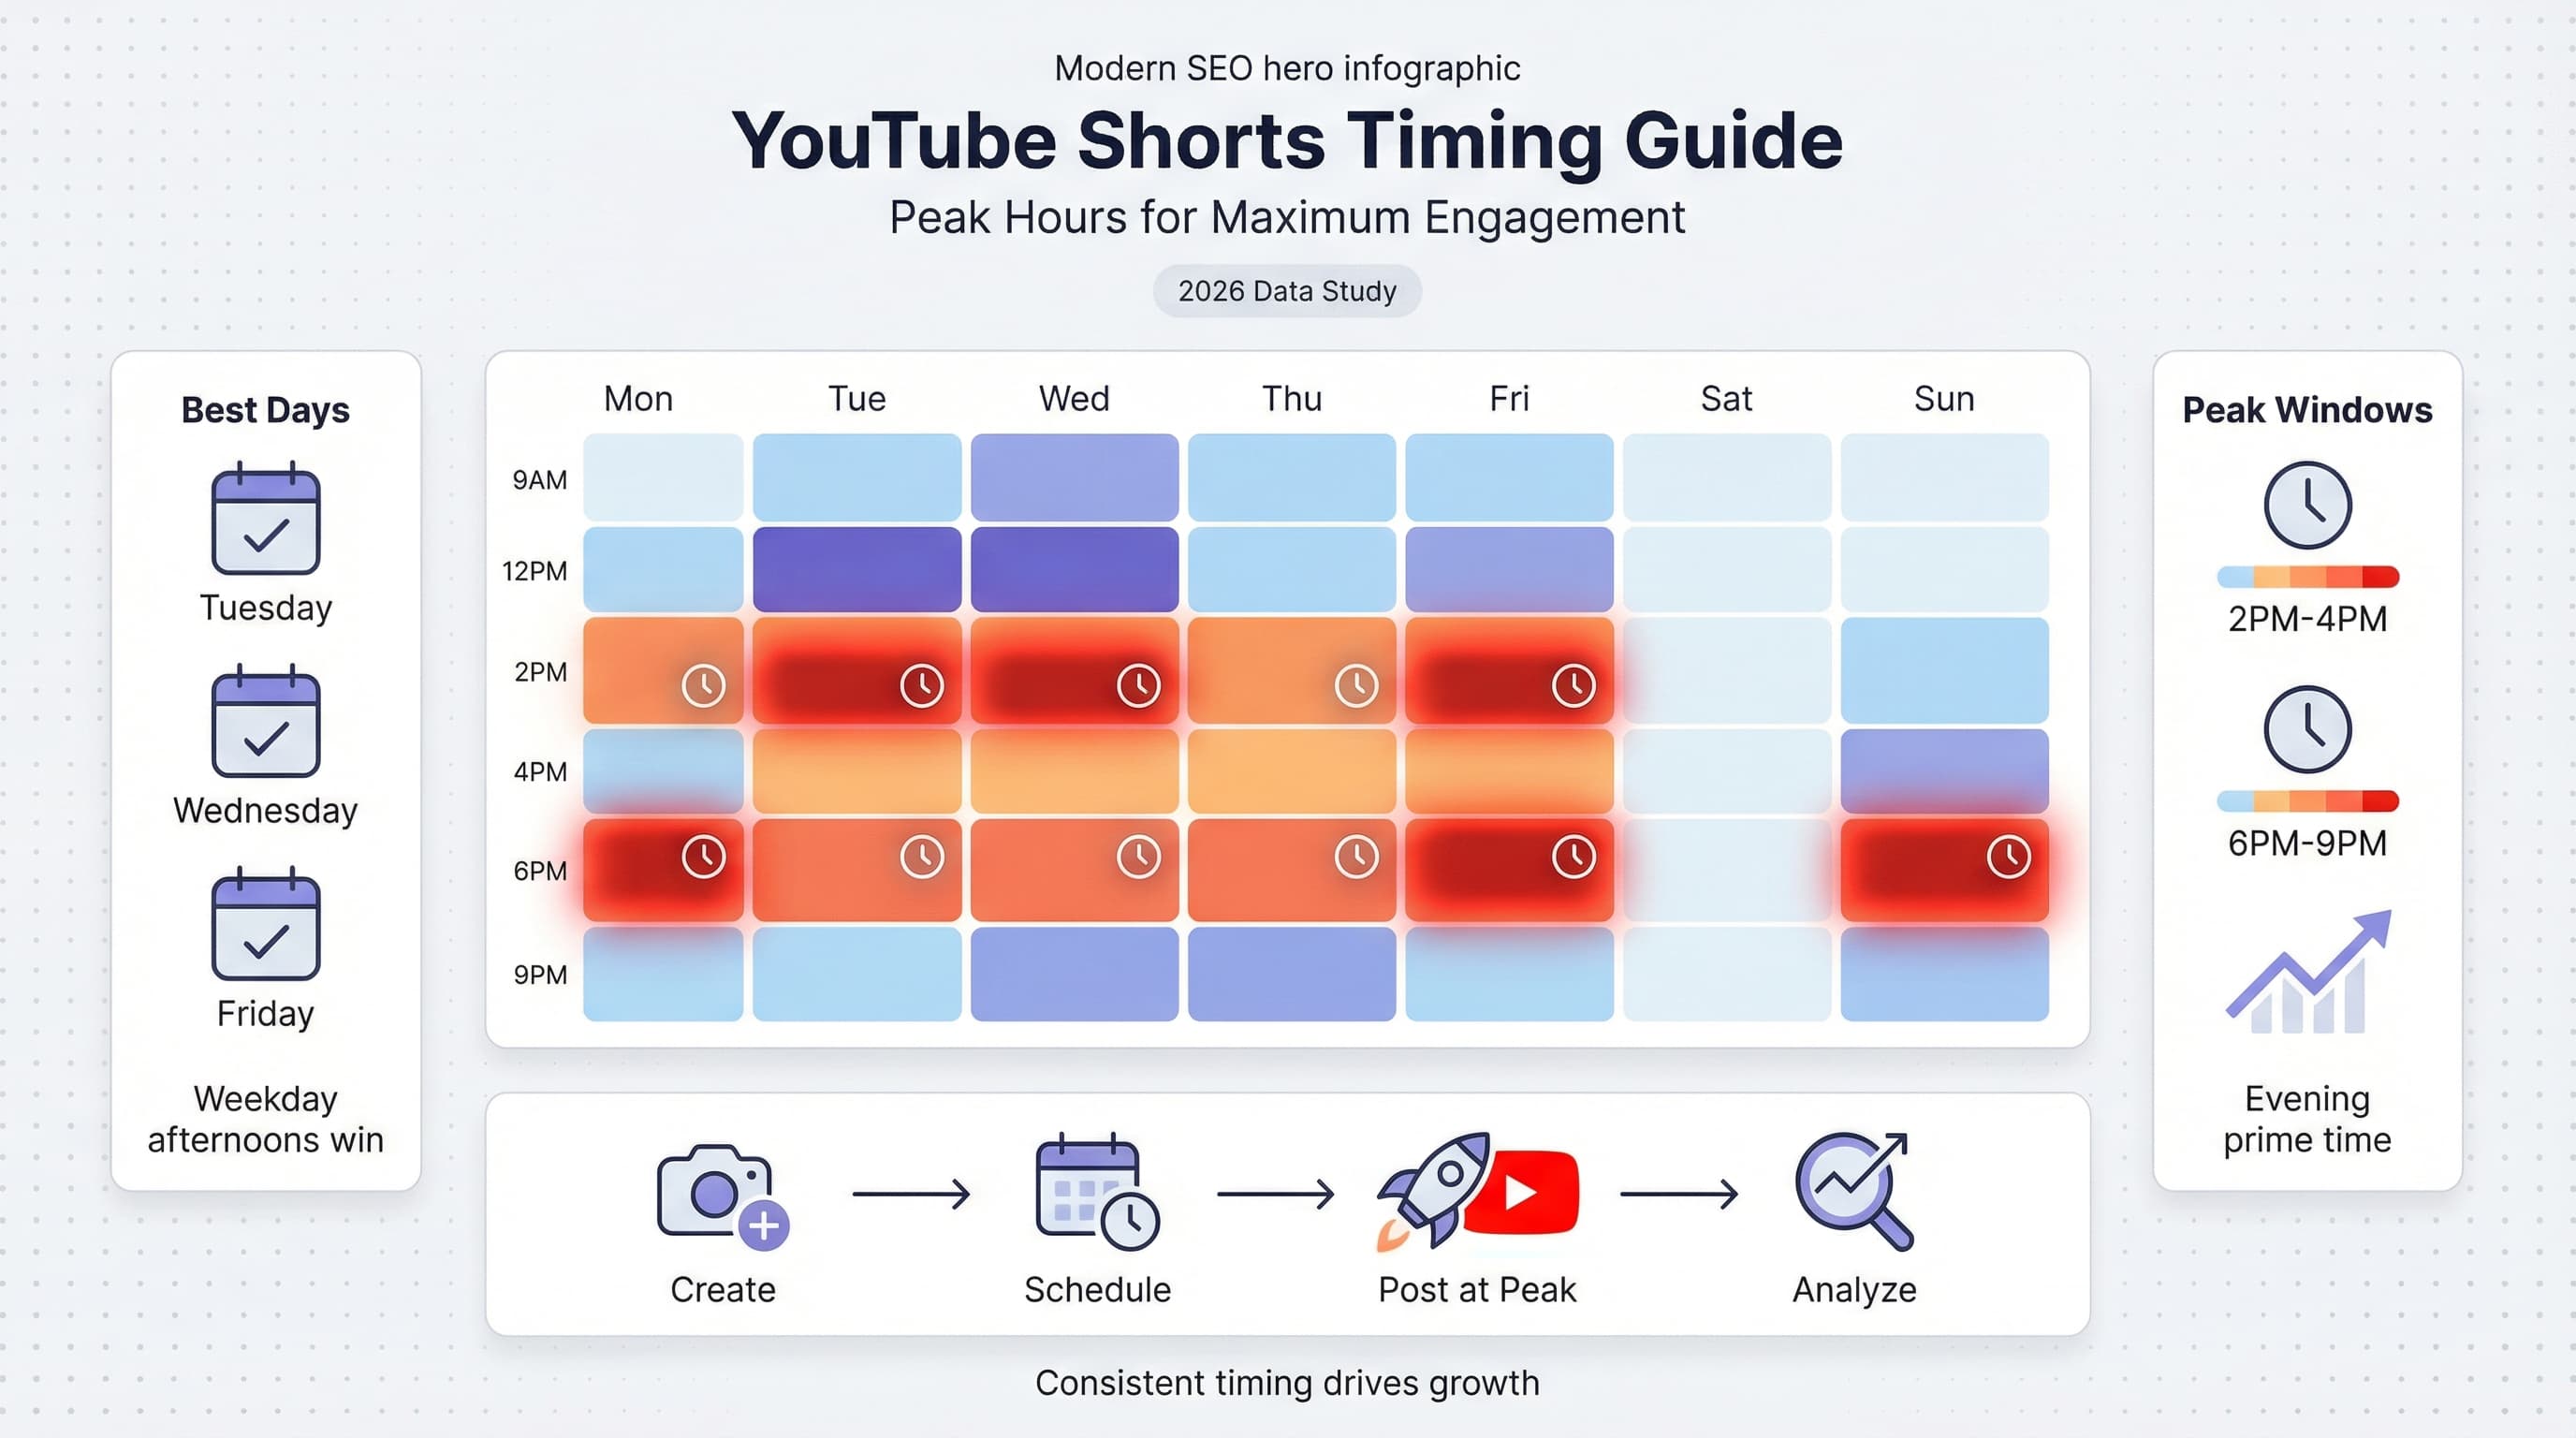
![YouTube Shorts Script Templates [Free Download] - 15 Proven Templates That Drive Views](/_next/image?url=%2Fblog%2Fyoutube-shorts-script-templates%2Fheader.jpeg&w=3840&q=75&dpl=dpl_GkyztBEXuuXhWyToUzpRTzGUmrPC)